

"What's for Lunch?"

The original title of my book with PRESALES ALREADY BEING SHIPPED was “What's for Lunch?”
I liked that title. It had some personality to it. It represented what I believe is one of the most powerful demonstrations of the book.
The publisher was probably going to let me run with it. But I decided it'd be better to go with something more directly relevant to someone who only reads the title.
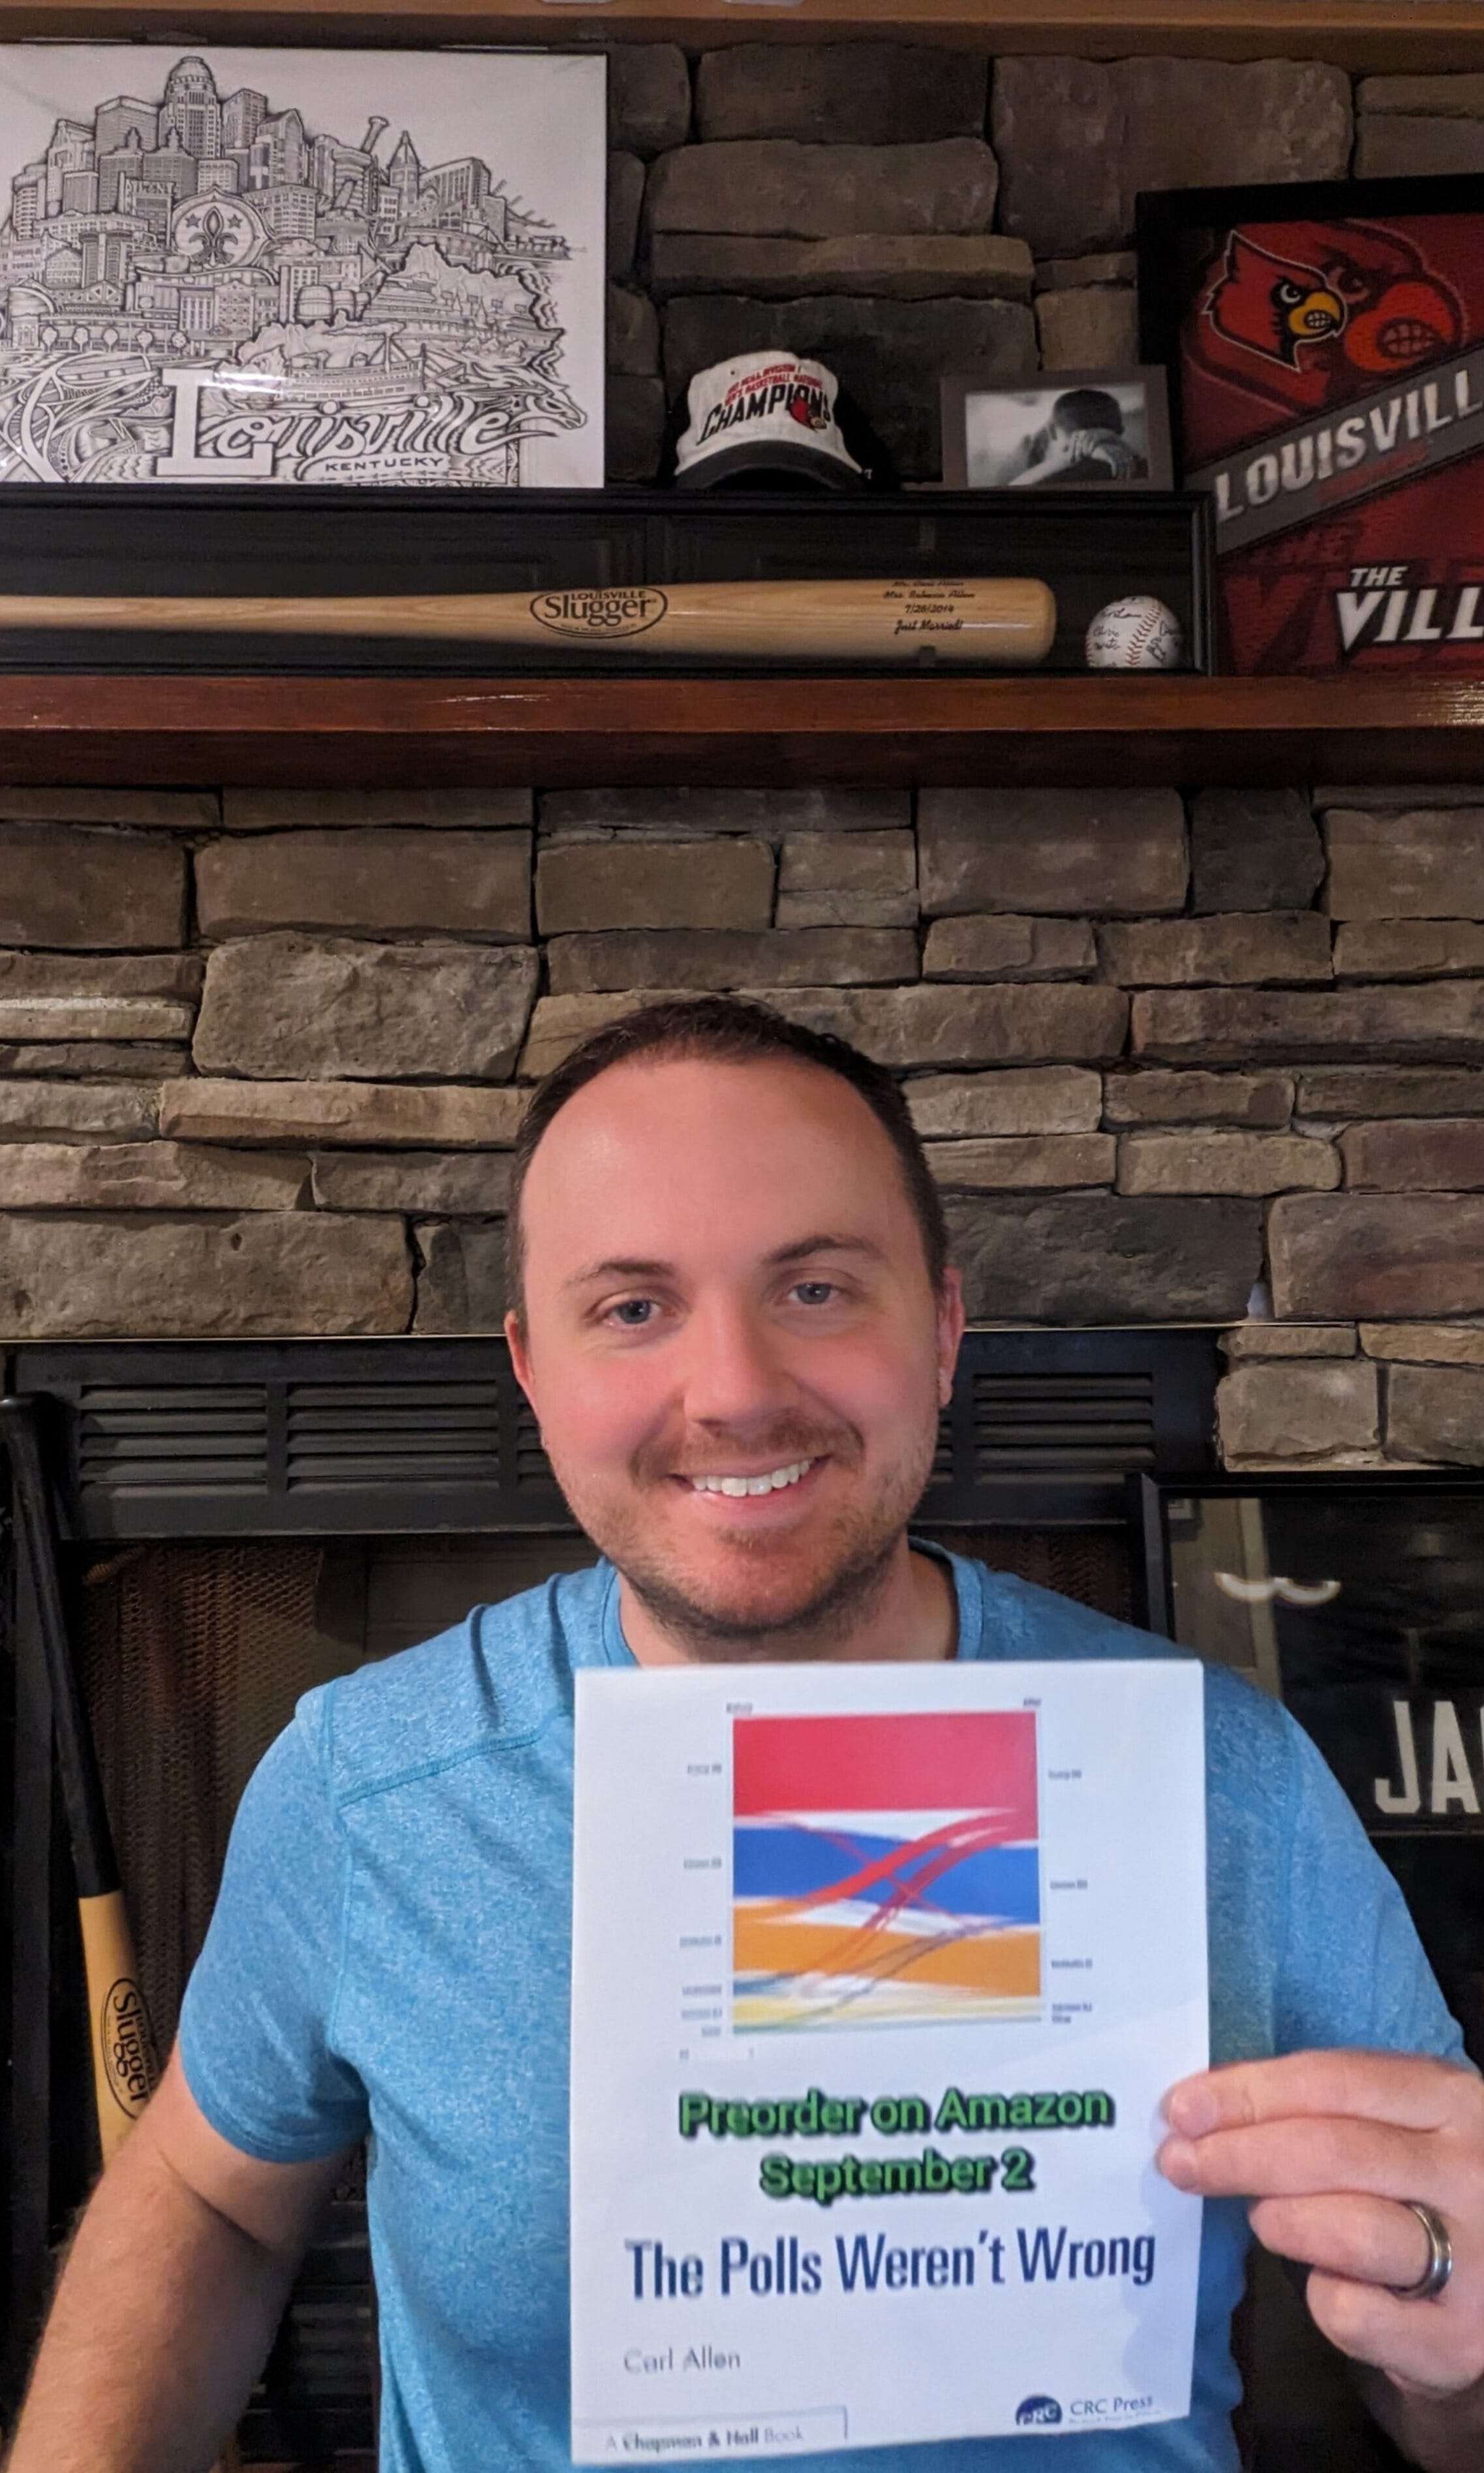
“The Polls Weren't Wrong” was born.
“What's for Lunch?” origins
In my many discussions with people in the field, they seem to believe that political polls are the only class of polls. At least, the only class of polls that matter.
My arguments (even those based purely in math, not related to political data) are contended based on how they can't apply to political polls.
“It's hard to take a random sample, you never know for sure who a “likely voter” is, etc etc deflection deflection.”
I'm not sure how I'm supposed to politely explain to someone that statistical rules don't cease to exist just because they don't conform neatly to their desires for information.
So, in my experience, I find that there's a numeracy issue, and a scientific gap.
In an attempt to bridge that gap, I like to give intro-level examples using marbles (just like the guy who basically discovered poll math did) and talk about a giant container with lots of marbles…and a random sample drawn from it.
And the rebuttal is almost always something like: well that doesn't count because people aren't marbles.
Or, frequently, “I am very smart I don't need such a silly example, this is so easy. Let's talk about political polls now.”
Ugh
Rules of statistics don't cease to exist just because….
No, be nice.
So, I respond with something closer to - right, people aren't marbles and that complicates polls involving people, but that doesn't mean the math from which the margin of error is derived doesn't treat them like marbles!
(The math underlying the margin of error does treat people like marbles).
Nothing comes of this. Usually where it ends.
To a laymen, saying “but people aren't like marbles” is convincing, for many reasons.
It's perfectly reasonable, by the way, to assume the math would be different for marbles vs people.
But for someone who understands how statistics like the MOE work, it's nonsense. And that lesson is covered very early in the book.
600 marbles to a container of a million marbles.
600 registered voters to a population of a million registered voters.
Same exact MOE is reported. And in the conditions required by the MOE formula, they are provably, mathematically, experimentally, anyway-you-slice-it the same.
There is no difference in how these two “experiments” or data collection would be analyzed and reported.
Many experts in this field don't interact with me past this.
This presents a problem I won't go too deep into here (present polls vs plan polls).
But as you know, marbles can't change their mind OR be undecided about some future event…while people can…there's a problem here.
The short version is:
Polls and elections are not the same (often not even close) to poll and simultaneous census.
Some polls, believe it or not, have more undecided than decided. And many have more undecided than favor any candidate or option. That's not a weakness of a poll, it's a reflection of the population…which is…what a poll is!
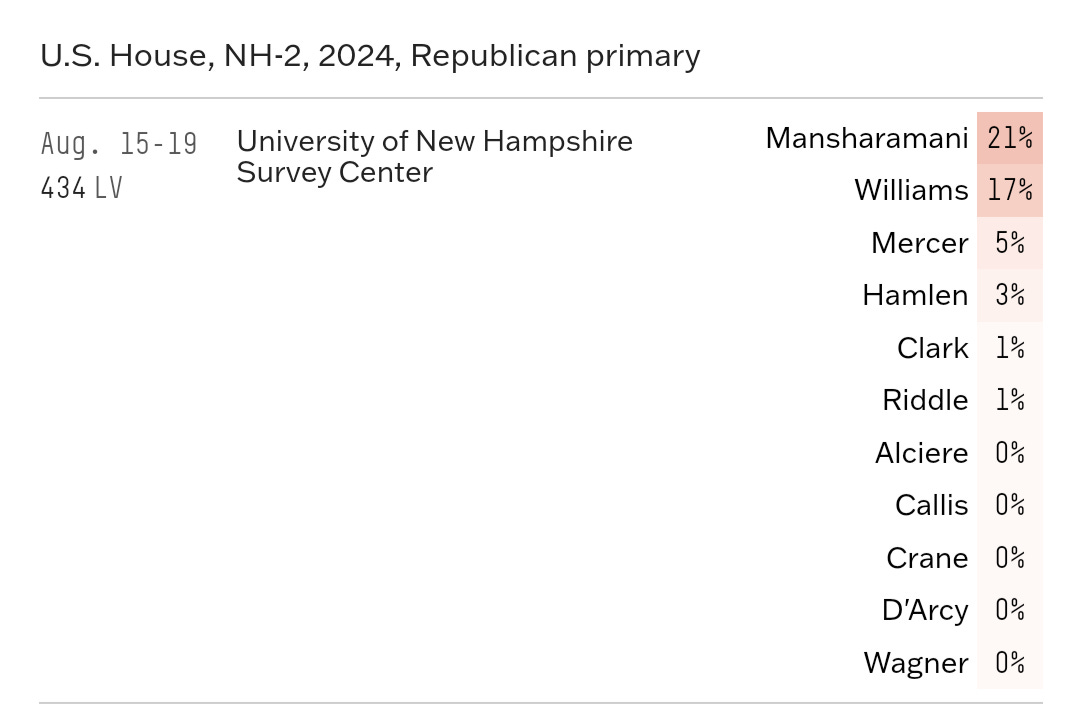
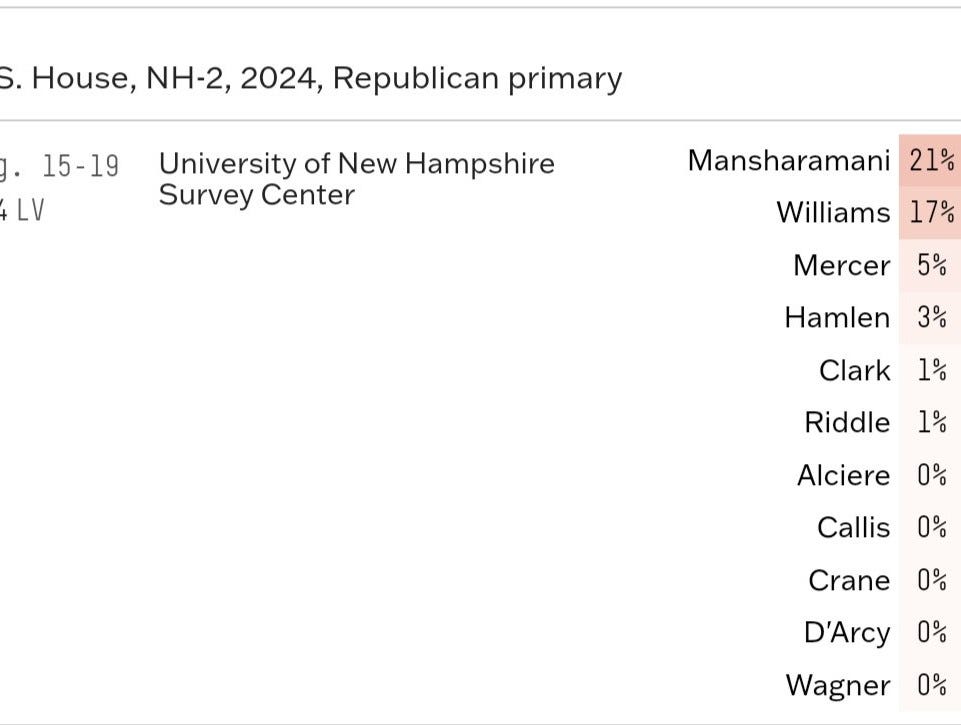
This poll was taken just a couple weeks before the election. 52% are undecided.
Mansharamani lost by 9. Therefore, polls were off by 13. Up by 4 in poll, lost by 9 in election. No other possible explanations here.
By this point, the few who do see a problem with this analysis STILL see no issue comparing poll results to election results.
So I have to show why it's not valid.
The purpose of experimentation isn't always to discover something new. The math underlying the margin of error has been around for at least 300 years.
But what the data given by a poll MEANS is clearly not understood.
So I'm happy to demonstrate.
What's for Lunch?
Polls are mostly used when the population of interest is too large to talk to everyone in it. That's why they're a powerful tool.
Given a simple random sample, just 600 people from your population of interest gives you a margin of error +/- 4% for a population of millions or even billions.
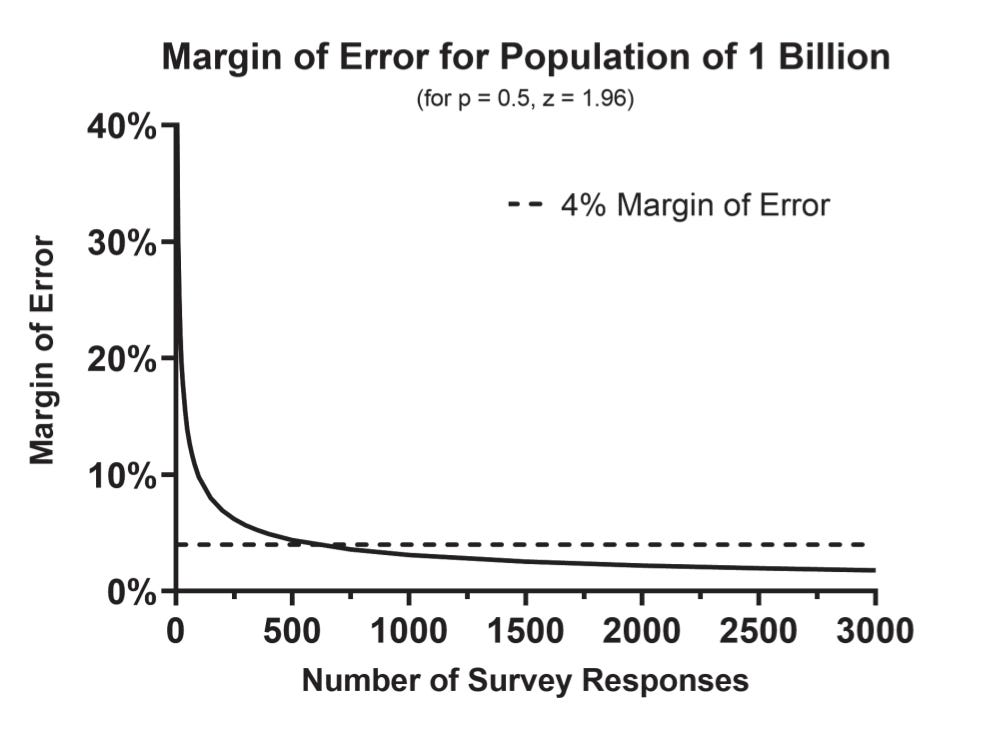
This is a counterintuitive, but indisputable mathematical truth - given a population of any size, if you can randomly take a sample of 600 from it, you can estimate almost anything about the population with a very high level of confidence, with a margin of error of +/- 4%.
I start with the counterintuitive truth here, because the question becomes:
“What does this 600-person survey tell me about the billion person population?”
The answer is:
If you had taken a census of the population, and asked the same question with the same options instead of a random sample (and in the same timeframe), the results would probably fall within the MOE.
This is a slightly simplified version of what I have called the simultaneous census standard.
This is the proper “true value” a poll attempts to measure.
Cool.
“But Carl, you can't take a census in political polls! So that standard doesn't work because it doesn't apply to political polls!”
I'm not interested in arguing about mathematical facts. There's nothing to debate here.
Whether or not the census is “possible” is irrelevant to the proper application and understanding of what is (in math world) a very simple formula.
The same underlying math for a random sample of 600 to a population of 1 billion
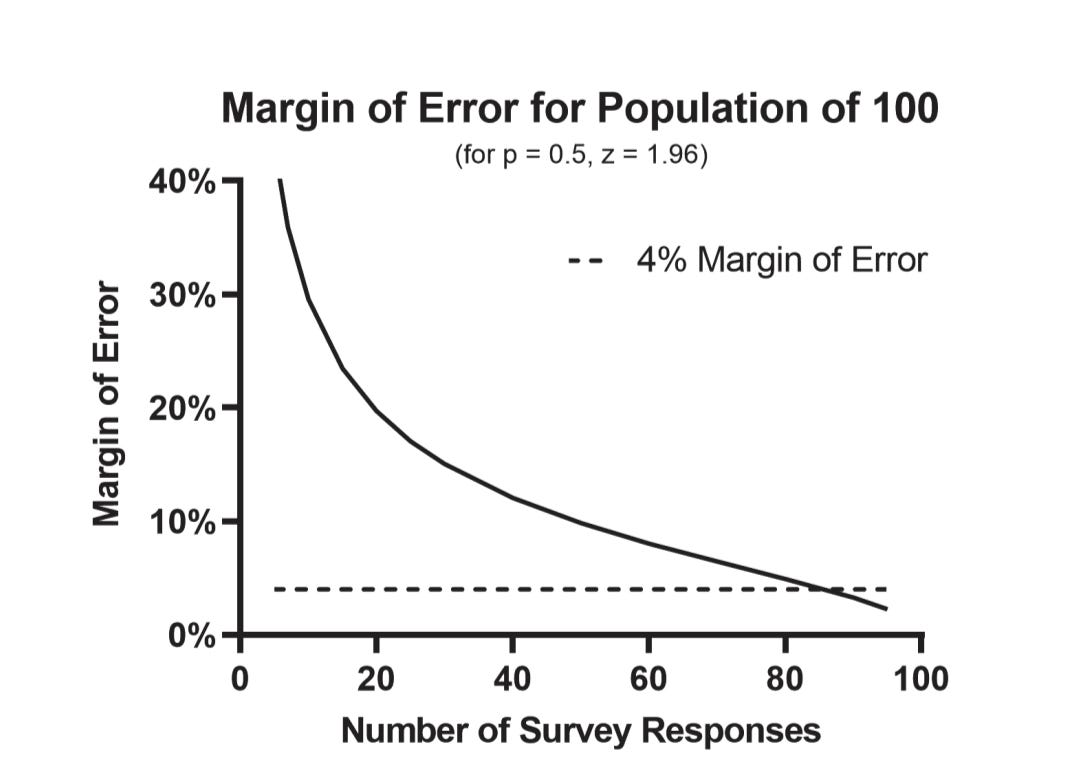
Applies to a random sample of 86 for a population of 100.
Margin of error +/- 4%, and 95% confidence.
In other words, what the sample of 86 tells us about the population of 100
Is the same thing a sample of 600 tells us about a population of a billion.
This is called “generalizability”
Ask a random sample from a population a question, the margin of error applies to what a true census of that same population would have said to that same question, with the same options, at that same time.
I don't make the rules and I sure as shit didn't discover them. But that’s what the MOE applies to.
I call it a “simultaneous census.” You can call it whatever you want, but if you try to apply the MOE to anything else (like actual experts currently do) you're wrong.
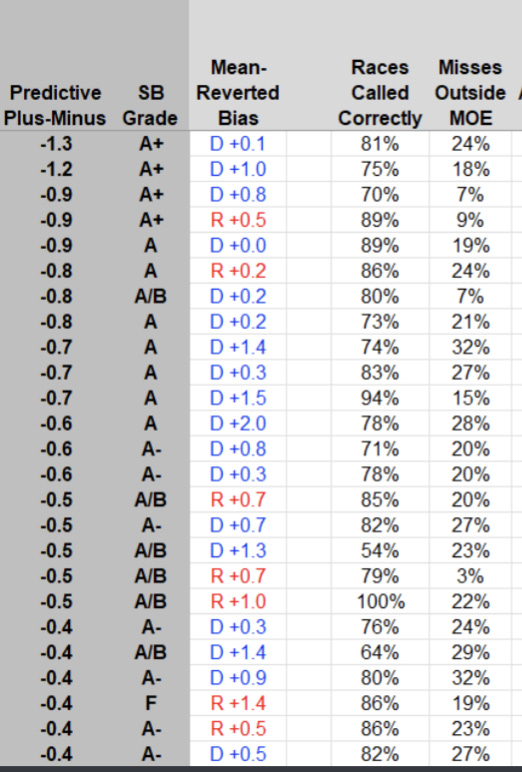
As for the misplaced obsession with whether or not a pollster “calls” a race correctly…that's just garbage.
I'll ask again, what exactly was this New Hampshire pollster “calling”?
Silver says it's calling that Mansharamani will win, and plugs that into his stupid-ass spreadsheet.
That's wrong.
Obvious as it may be to you, reader of my work, I don't expect you or anyone, even people skeptical of my analysis, to just “trust me bro.”
The science (and logic, it turns out) behind polls not being “calls” of elections or a prediction of the election margin is hard even for people who do it for a living, clearly. They literally say they are!
So I don't expect someone who doesn't analyze polls professionally to immediately “get it” when even experts can't.
I'm something of a scientist, in the sense that I'm happy to test assumptions at anyone's convenience, so when otherwise smart people tell me the poll-data equivalent of “eggs and watermelons dropped from a high building won't hit the ground at the same time, because watermelons are heavier”
I'll be the first person to climb the building with a few dozen of each to test it.
I'm happy to demonstrate they're wrong, because math alone clearly isn't enough.
Alleged experts literally say that the election result is the “ground truth” for poll results, and the poll(s) accuracy can be measured by how well they “predict” election results. Below is a very, very, very short list of names and organizations you might be aware of saying polls “predicted” something - and there are thousands more examples.
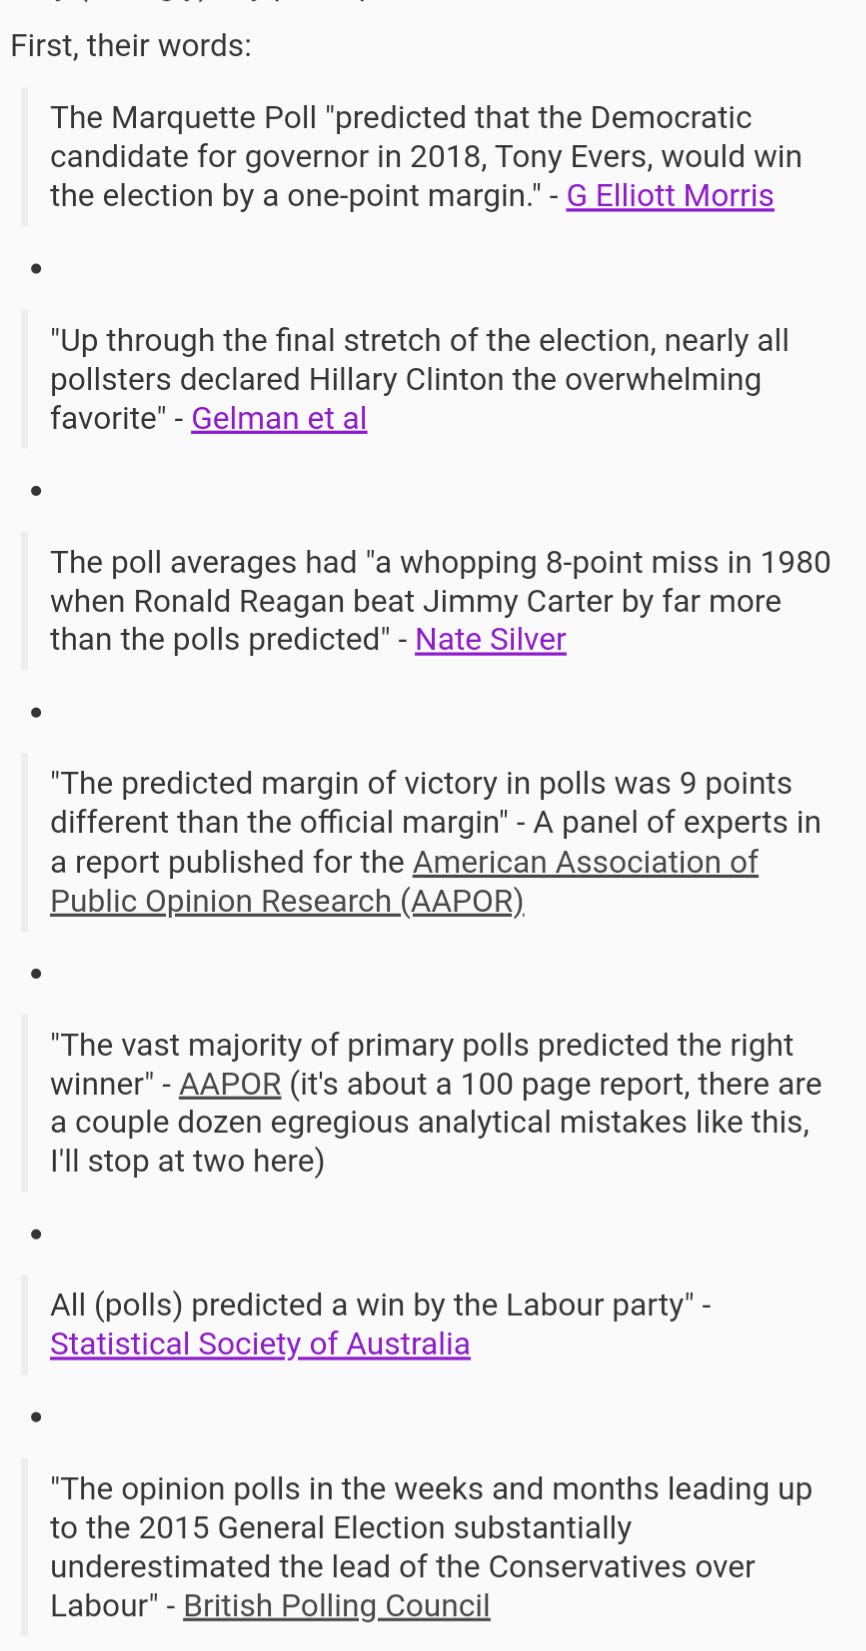
And they are all wrong. The proper “true value” is the simultaneous census, not the election result. But clearly if experts have trouble with this concept, the public does too.
So let's test it.
Question:
What do you plan to have for lunch tomorrow?
A) Pack lunch
B) Purchase lunch (restaurant, etc)
C) Don't plan to eat lunch
D) Not sure yet
Given a population of 100, a random sample of 86 will give a margin of error of approximately +/- 4%
It's very easy to find a population of this size (teachers and staff in a school, a couple classes, a workplace, etc)
Anyone can do this.
And it's also very easy to ask them the question, and get a 100% response rate.
So, where are the possible sources of error in this poll?
Not to dismiss the possibility that I could have counted their responses wrong…but there aren't any realistic contributors…
*Except the margin of error*
Chapter 4 introduces this new term: a poll whose only source of error is the margin of error is an ideal poll.
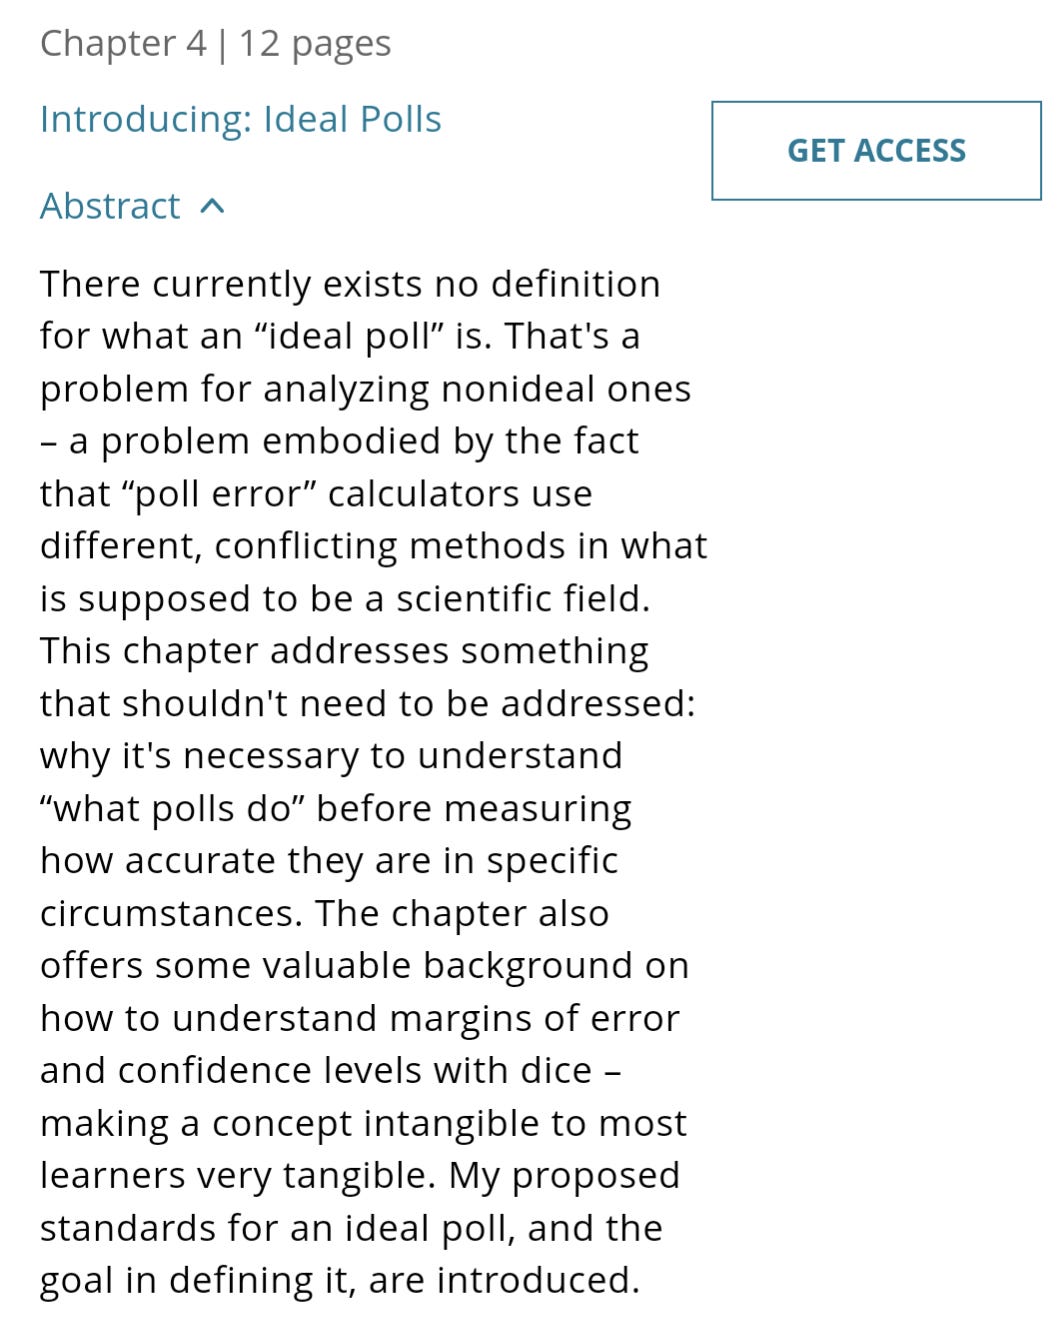
At the request of the publisher I won't be using the exact data as the experiment in the book, but I'll use numbers from a more recent trial.
This ideal poll standard allows us to test the “simultaneous census” standard, to the current “eventual result” one.
Remember, mathematically speaking, an ideal poll with 95% confidence will fall within the margin of error “in the long run” 95% of the time. Not 90%, not 99%. 95%. Mathematical fact.
Which is to say, if I perform this experiment dozens, hundreds, or thousands of times, given that the only source of error is the margin of error, then either:
The simultaneous census standard (my proposed standard) will produce results equal to what the margin of error says it will, or
The eventual result standard (the current standard) will produce results equal to what the margin of error says it will, or
(Because I'm a stickler for detail) The formula for the margin of error is wrong and it doesn't matter if it proves “1” right.
What do you think we'll find?
I know the answer, I suspect you do, and I can't help but laugh at the indisputable fact that this field’s perceived experts don't.
In one of the few dozen experiments I've done on the theme, I collected responses of:
A) Pack lunch: 43/86 (50%)
B) Purchase lunch: 28/86 (33%)
C) Don't plan to eat lunch: 0/86 (0%)
D) Not sure yet: 15/86 (17%)
So, simple question, what does this data mean?
The answer the (US) experts give:
Pack lunch is “up by” 17% (50% to 33%)
Since the poll is taken so close to the event, it is said and accepted that we can assume:
No one will change their mind
Undecideds will split evenly to the main two options
Therefore, the poll’s accuracy can be measured by how closely the final results are to “pack lunch” up by 17.
That means, without exaggeration or exception, bonafide experts in this field state that the accuracy of this poll can be measured by how closely the final results are to:
Pack lunch: 58.5%
Purchase lunch: 41.5%
+17 in poll must yield +17 in result otherwise Polls Were Wrong.
See the problem?
Let me explain.
Here was the poll, with MOE of +/- 4%:
A) Pack lunch: 50%
B) Purchase lunch: 33%
C) Don't plan to eat lunch: 0%
D) Not sure yet: 17%
How do we get from 50% to 58.5%?
Or from 33% to 41.5%?
Well, in this case…
Current methods assume undecideds will act according to this “even split” assumption.
OR
That even though some people might change their mind, if that happens, undecideds will (through some unspoken, presumably magical mechanism) decide in a way that makes the “net” assumption (final result Pack +17) hold true.
And if it doesn't, Poll Was Wrong.
Is that what the data given to us by the poll means?
Nope.
The data given to us by the poll means that, if you had taken a CENSUS OF THAT POPULATION instead of a poll, each number would almost certainly be within the margin of error.
A simultaneous census.
Pack 50% +/- 4%
Purchase 33% +/- 4%
And roughly, 17% +/- 4% of a census would have been “undecided”
Period.
That's all it tells us about undecideds.
Forecasters (who largely build their models around this 50/50 assumption) have by some unscientific travesty, successfully convinced people up to and including the field's foremost experts that if their forecast “missed” the result, it can only be because the polls were wrong.
And analysts use this assumption exclusively.
I have a simple response:
The proper standard for evaluating a poll's accuracy is the simultaneous census standard. The math underlying poll data proves it, but that's not enough.
So “What's for Lunch?” is, I hope, an easy enough starting point for interested learners to understand what the margin of error means.
In that sample, I observed:
50% pack
33% purchase
17% idk
And wouldn't you know it -
When I completed the census by counting the 14 results that were not included in the random sample, the “true value” (simultaneous census) was:
52% pack
32% purchase
16% idk
All within the margin of error, as ideal polls judged by the proper simultaneous census standard will usually be.
Completing this census, in this case by viewing the answers of the 14 people that were not part of my random sample, is mathematically the same - same margin of error - as viewing the answers of 999,999,400 after a random sample of 600.
They will fall within the margin of error exactly as often.
But wait
What did they actually have for lunch?
Surprise.
I went back and asked the same group two days later. What did you all had for lunch?
63% pack
37% purchase
That's a 26-point “spread”
Compared to a 17-point spread in the poll.
So, what happened? Was my poll whose only source of error was the margin of error fall well outside the margin of error, as even ideal polls sometimes do?
Or did we just demonstrate something that should be easily understood by any respectable learner or practitioner of science:
Your assumption about what undecideds will do (or how many people will change their mind) doesn't mean shit to the math underlying the margin of error.
If “idks” favored pack, that's not a poll error. That's not the polls being wrong. That's you making an assumption you assume can't be wrong, and not understanding how mathematical formulas work.
So I'll leave you with this:
If you believe the proper standard for poll accuracy is the election result margin, you're in great company. The consensus of the field's experts are with you, and it's basically just me trying to show and/or convince people it's wrong. At least for now. I'm not offended that someone would side with them, if what I have written is insufficient explanation or doesn't make sense.
But I will say this:
By the currently used “eventual result” standard, even ideal polls whose only source of error is the margin of error will fall outside the margin of error quite often.
But by the simultaneous census standard that I propose to judge poll accuracy, it will fall outside the margin of error exactly as often as the mathematical formula says it should, and no more, and no less.
And this has instantly transferrable value for how poll data is currently analyzed.
If this strikes you as interesting, important, or otherwise impactful, there's a ton more in the book, including direct analysis of political examples, and applications of what I believe should be a fundamental understanding that produce some data you will not believe regarding what poll data DOES tell us about who wins elections.
Buy the book here and help me kick this field in the ass.