
Introducing: Ideal Polls
What they are, and why it matters

Long before I analyzed political polls, I was a scientist. Not long after, I became an educator.
In recent years, I have learned that:
People who analyze poll data violate several logical and scientific principles
Explaining to them why their analysis is unscientific - and how to better teach it - is more challenging than it first seemed
To paraphrase a science educator I hold in high regard:
“In order to teach something, you have to understand it 10 times better than others. You can't just tell them the lesson; you have to meet them where they are, find the gaps in understanding, and find a way to fill the gaps. That's the difference between a teacher and a lecturer.”
That resonates with me. My instinct in any discussion or lesson is to teach. So I'll give you the short version of how I got to “ideal polls.”
Step 1: Identify the Problem
Currently, the worldwide consensus is that polls, if accurate, will predict the outcome of the election, and margin of victory.
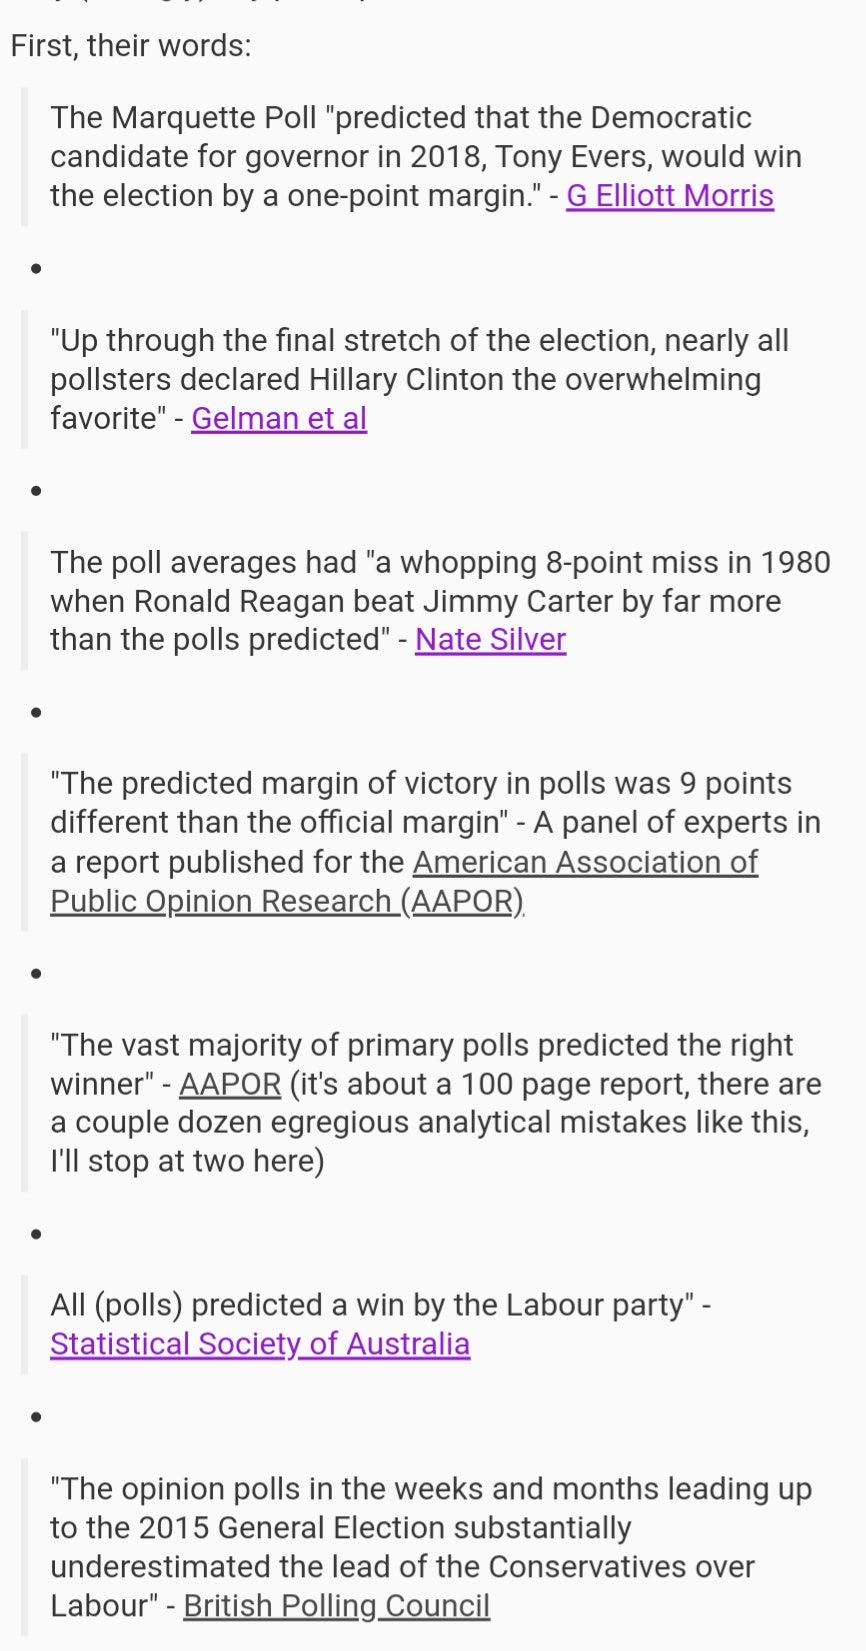
That's not correct. The above is a very small sample of the exact same reasoning: polls-as-predictions.
Frustratingly, these same experts claim to understand that “polls are not predictions of election outcomes” - while simultaneously doing calculations, and analyzing poll accuracy as if predicting the result is what they are intended to do.
It's rhetorical whack-a-mole: they claim to understand something, and offer mostly correct explanations in the abstract sense (e.g. “polls are like snapshots”) …
Then when it comes time to apply that understanding to actual election data, they totally abandon that claimed understanding by comparing the poll data “snapshot” to the eventual result.
In short, yes, polls can be thought of as blurry snapshots of public opinion. It's a good analogy.
Now: what does this snapshot predict about the race result?

It's a dumb question, isn’t it?
If you ask me to predict the outcome of the race, I'd love to have a snapshot from it. Great data. But that's not the question.
The question is: can we judge the accuracy of this snapshot by whether or not the person pictured ahead eventually wins, or by how closely it reflects their margin of victory? “Of course not!” you laugh to yourself. Right. Snapshots short of the finish line provide valuable data, but they don't predict anything. Welcome to my hell.
Now, a more rhetorical question:
How do you teach someone who says:
“A snapshot is only a picture of the race's current state, not a prediction of a future state”
But then, after the race is over, publishes in academic journals, the media, and teaches students:
"The snapshot didn't predict the right winner.”
“The snapshots predicted (insert name of woman in front) would win.”
“The predicted margin of victory in snapshots was 9 meters different than the official margin.”
The snapshot averages had a whopping 8-meter miss.”
That's the battle I get to face.
So, as a teacher, I'll meet them where they are.
Step 2: Identify the Gap in Understanding
The misunderstanding is the belief that polls, if accurate, will predict the election result: as evidenced by the words and calculations for “poll accuracy.”
The overarching reasons they hold this misunderstanding are one or all of the following: we want polls to tell us who will win, it feels like an intuitive calculation, and this is how poll accuracy has always been calculated.
But what is true - at least in science and education - is more important than what we want, what is easy, or tradition.
Since this is a foundational mistake of “what does the data given by polls tell us?” …it requires a foundational correction. I understand foundational corrections are uncomfortable, but there's not an alternative here. And when people don't see why that foundational correction is needed, as is the case here, it requires more in depth explanation.
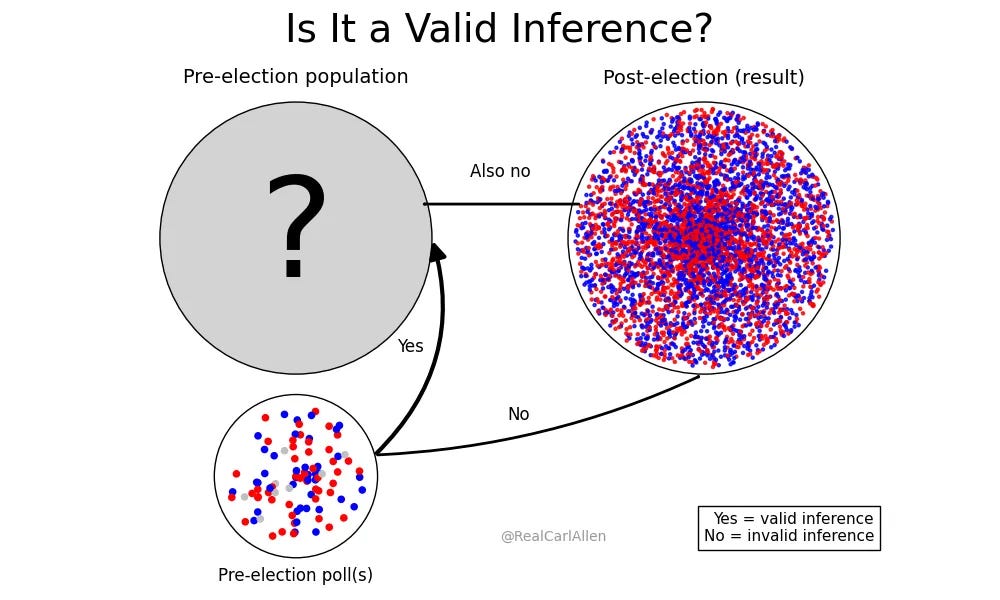
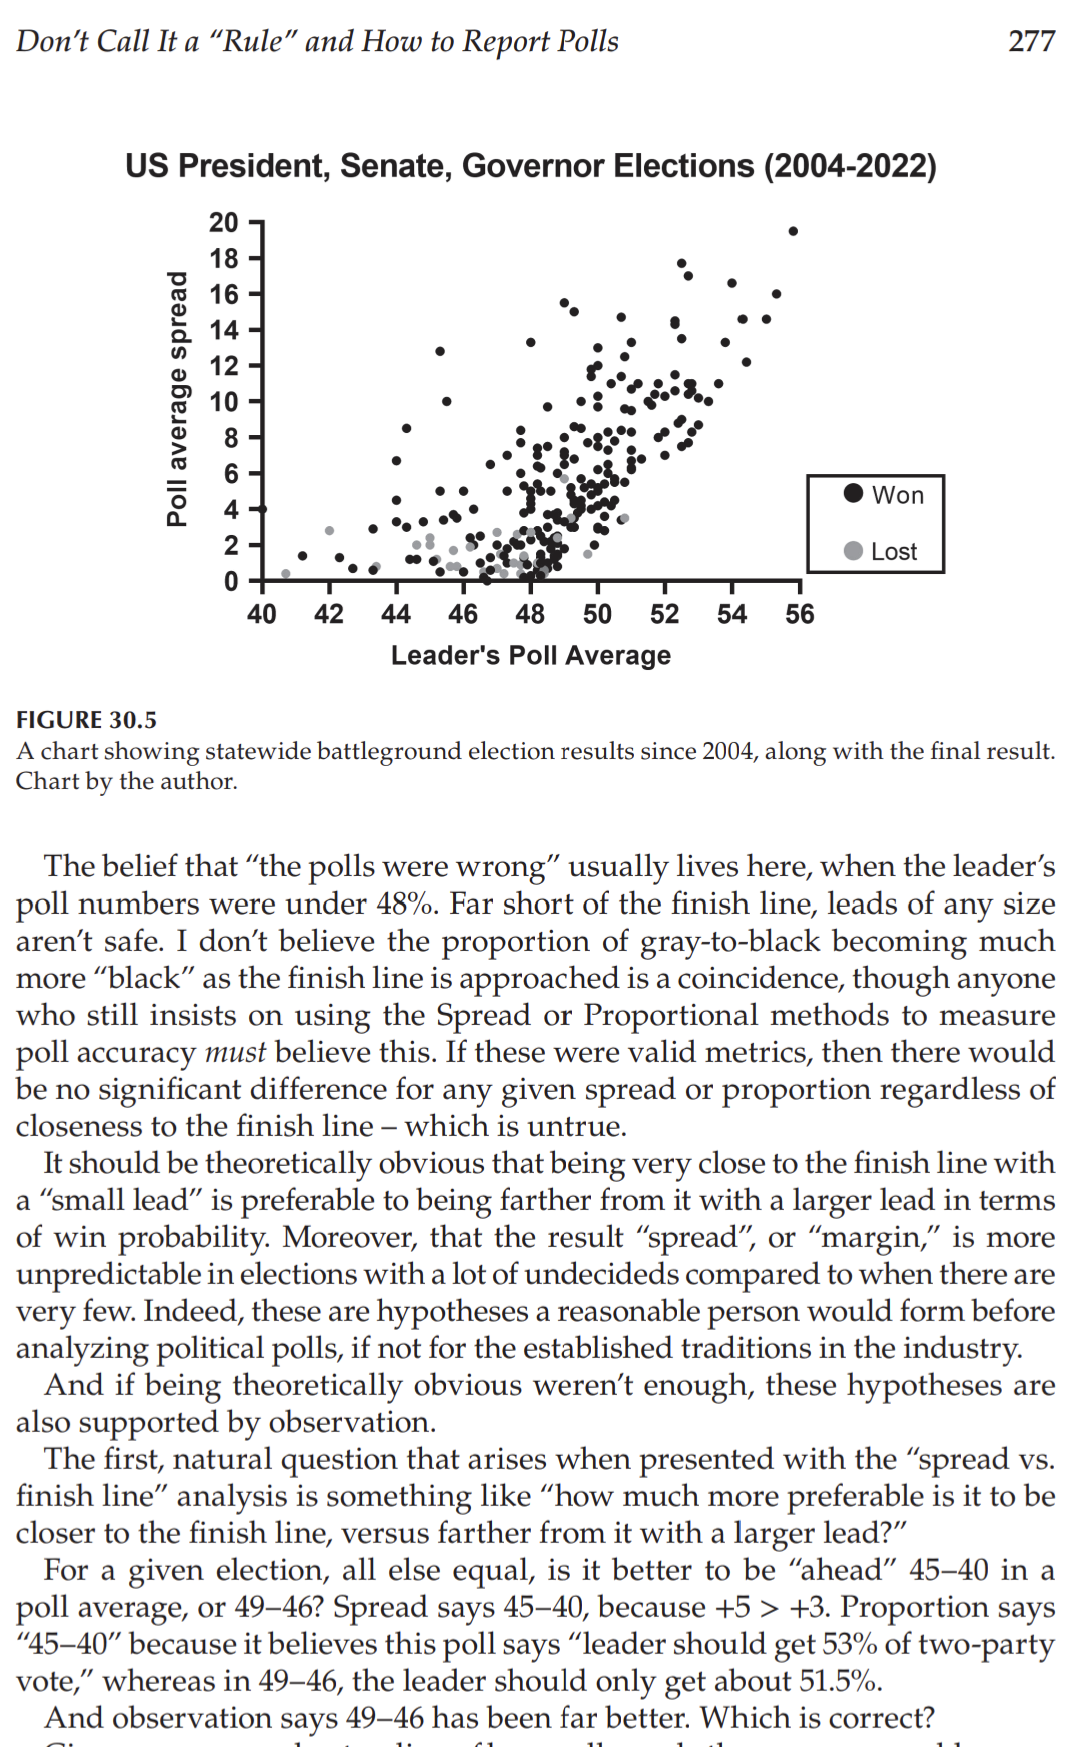
When presented with this chart, people claim to understand it. Yet, in their analysis (comparing poll margin to election margin) and their words (“polls predicted…estimated…” some result) they're demonstrating they do not: they violate the “no” line.
It's subtle: asking a group of people who they plan to vote for, then comparing it to who they actually vote for - it feels like a valid inference. Even if imperfect, it should be pretty close, right?
(Subtle variable change like this has famously caused otherwise respectable statisticians to be very incorrect before, and it's doing it again)
For one, I must note: there is no admission or notation that the calculation is approximate or otherwise “imperfect.” It is claimed to be correct, and poll accuracy is asserted as known based on this calculation alone. It's not, and that should be a big enough problem on its own.
But it's even more imperfect, and scientifically problematic, than you - and the field - seem to realize.
Consider the two primary confounders created when comparing a pre-election poll to the election result solely on the basis of “margin,” or “lead” or “spread”:
People can change their mind between the poll and the election
This fact is well understood, even by experts. It has names like “late swing,” “changing attitudes,” and “temporal error.” No matter what you call it, how do they (currently) account for it?
They don't. In their calculations for poll accuracy, they assume it to be zero. This is unscientific problem number one. Some analysts say “changing attitudes” can be assumed to be zero within two weeks of the election, others three weeks, others “after Labor Day” (roughly two months). There's no standard because it's just an assumption.
How undecideds decide
Although it's sloppily thrown in with “late swing” - it should be kept distinct due to the net gain/loss calculation for a given candidate - the existence of this confounder is, at least, also known. Nonetheless, once again, different analysts use different unscientific guesses to pretend this problem doesn't exist. US analysts say undecideds will split evenly, while analysts from most other countries say undecideds will split proportionally to the decided. The existence of incompatible assumptions illustrates the unscientific nature of these calculations. And again, all are wrong because all are unscientific assumptions.
Consider the problem this creates in how we evaluate polls with a large number of undecided voters.
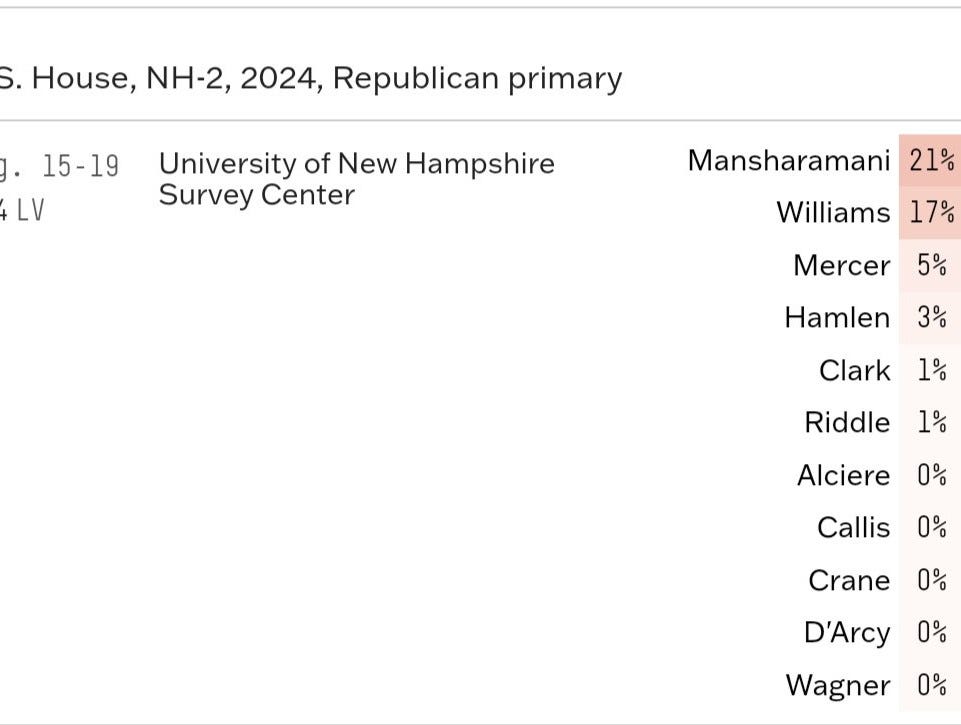
Naturally, primaries in House races like this tend to have many more undecided voters than Presidential elections because candidates are less well known. No problem, right?
Now consider the reality that the current academic consensus is that primary polls are - for some reason - “less accurate” than Presidential ones.
Damn, why could that be?
It turns out, assuming 15% or 50% undecided will split evenly (or proportionally to the decided, depending on which pseudoscience your country prefers) create some very large misattributions of error. Under American analyst pseudoscience, given a seemingly innocent 60-40 undecided split:
For 15% undecided, 9-6 generates 3-points of non-existent error.
For 50% undecided, 30-20 generates 10-points of non-existent error.
How do analysts account for the fact that undecideds splitting in a way contrary to their assumptions can cause enormous errors in their poll error calculations? They don't. They can't. It's foundational. Instead of addressing this flaw, they move the goalposts to the fact that I'm using “extreme” examples. For one, “60-40” is far from extreme. But let me grant your premise: if your calculations don't work for extreme examples, they don't work for less extreme examples either - the cracks just become less obvious. The mathematics I practice doesn’t grant exceptions for being “close enough, usually.” A formula that breaks under stress isn't sound. There's a Newton versus Einstein analogy here wasted on people who clearly haven’t studied proper science: being wrong “within tolerable ranges” is still wrong. The shorthand might be “close enough” in some circumstances, but introducing extreme examples is only intended to illustrate the foundation is cracked even if you can't see it.
But hey, maybe I'm just nitpicking about a minor flaw, right? Even many people “on my side” scientifically first land here, including some who wrote glowing reviews of my book: they confide in me that this is definitely a worthwhile fight, important, but not as big of an issue as I make it.
Fair, let me continue.
Consider that a 60-40 split of 10% undecided is “only” 6-4, while the assumption may have been 5-5. “Only” two points of error misattributed to the poll by this assumption. I'm so tedious and pedantic! Only two points!
Currently defined, two points of “error” is considered “historically accurate,” and polls with four points of error are considered “below average." The fact that analysts would view two misattributed points of error as negligible illustrates incompetence, ignorance, or both. This is without even getting into the previously unconsidered algebraic reality of compensating error (since error can be positive or negative), that shows two points of “error” in either direction can make an otherwise inaccurate poll appear accurate, and vice versa.
Even a casual observer could consider the possibility that the assumption that “no one changes their mind close to the election, and undecideds split evenly” could cause some very problematic calculations of “poll error” in this circumstance.
I wrote a book about it, and showed my calculations. The title is a spoiler.
Whether or not you agree with my conclusion is immaterial. My primary contribution to the field is much simpler, and indisputable: these variables must be accounted for before poll accuracy can be calculated, even approximately.
Meanwhile, the existing definition says we can “assume they are known.” Which is proper science? If you do poor science, you won't ever be able to explain reality: the current state of the field.
We have a tool, random sampling, designed to give us some output: an estimate with a confidence interval and margin of error. But with these assumptions being layered on top, we have analysts infecting a scientific observation - poll data - with their own assumptions.
In all, the challenge I've tasked myself with solving is to illustrate why that's wrong and how to teach it.
Simply showing a better way to solve the problem is not enough: they don't even acknowledge the assumptions are problematic in the first place, because of that foundational polls-as-predictions misunderstanding. So the task is made much harder than pure math. If you assume the Earth is stationary, someone providing you with better math to calculate Mercury's orbit won't convince you of anything: the better math first requires understanding that Earth isn't stationary!
(The polls-as-predictions consensus shares some remarkable similarities with the geocentric universe model, in that a single, flawed foundational assumption negates all the otherwise quality science being done. Read the article linked above if this analogy intrigues you)
So here's my solution:
Step 3: The Teaching Tool
“What does this data mean?” is the simplest, most important question to be asked.
With poll data, the current consensus is as follows:
“If this poll is accurate, then the result will produce a margin of victory equal to the poll.”
But that's not what it means!
Here's the right answer:
If this poll is accurate, then a simultaneous census of that population would probably (given the confidence interval) produce a result reasonably close to (given the margin of error) the numbers given by the poll.
This is, fundamentally, what the data given by any poll - political or otherwise - tells us. But that's not the answer currently given.
So how can we demonstrate it to people who don't understand it…or those who claim to understand it, but don't?
Ideal Polls.
An Ideal Poll is a poll whose only source of error is the margin of error itself.
I have spent dozens of hours teaching this concept to students, with great success, and debating it with educators, who see no value in it; a wonderfully representative sample of what's wrong with the field. Those debates with educators always begin with the claim that the ideal poll construct is “strictly theoretical.” This is irrelevant. For one, even if it were strictly theoretical, that doesn't mean it's not the (unspoken, previously undefined) foundation upon which all inferential statistics derive their value: it is. It is a poll in its purest form. It is the literal embodiment of the formula for the margin of error. It also doesn't mean there's not educational value in it, helping students better understand probability.
An “ideal poll” is not about describing reality in its messy entirety; it is about defining the standard against which reality can be measured. In the absence of a standard, critics conflate expected randomness with methodological breakdowns, and chance events with statistical superiority. They layer in assumptions about undecided voters and mind-changers, all of which is permitted when no standard is established. The field’s founding fathers Roper and Gallup debated this very topic and the role of polls in politics in the 1950s, and nothing was settled. The Ideal Poll resolves all mistakes and confusion for all involved by defining clearly what data polls can give us - and can’t.
But then, I'm embarrassed to admit, there's the part that's even more fun for me: ideal polls aren't “strictly theoretical” at all.
I can conduct an ideal poll in a few seconds, using marbles in an urn, or data from a spreadsheet. So can you, or anyone. The concept can be tested and proven, not just in theory (which should be enough) but also in practice. And at this point, without exception, the dozens of educators and academics I have discussed this with come back with “but that's not how real-world polls work.”
And there you see the goalposts move. Their contention was not based on utility or fact, it was based on preservation of the original belief. Once their contention was defeated, a new one is presented in its place.
I always return to their original claim that ideal polls are “strictly theoretical” and ask them to revise their statement, having been proven wrong. Admitting this doesn't end the debate, or concede anything of consequence on either side (whether Ideal Polls are theoretical is tangentially relevant, at best). And yet, they all (100%) refused. It has become increasingly clear to me over the years that emotional or egoistical attachment to existing standards, not best practices, motivates many in the field. And it may be closer to “all” than “many.”
On principle, I refuse to engage in further discourse with such people, without exception for credentials or my personal like (or dislike) of them. If you are unable to concede you were wrong about a very minor and easily proven fact, there is no use engaging on more meaningful ones. The purpose of academic discourse (and science as a whole) is to use facts, data, and logic to arrive at the most accurate explanations possible. Those who refuse to accept those explanations after being presented with it are not worth the paper their degrees are printed on. You may see why my tone fluctuates from academic to scathing at times; it's not because I'm impatient, conceited, or intractable (though I'm open to evidence to the contrary) it's because I have expectations for those who work in scientific fields, and in this field, and when they're not met, there can be no compromise.
Returning to a more neutral tone, let me share a quote I live by, which makes many uneasy:
Data is under no obligation to be useful to you.
With that simple sentence, I've witnessed loud voices turn silent, and defiant faces turned pale.
Political polling, for the past 100 years, has been built upon the imaginary foundation that “accurate” polls can, will, and do predict election results. Perhaps I underestimate the attachment people have to this belief and don't have enough consideration for their mindset; but good analysts shouldn't let desires to influence their ability to evaluate data. Currently, value is being derived, in many cases, from random chance. Single polls, close to the election, declared as a definitive indicator. Poll averages, in recent years, have become the new “signal.” Perhaps on some level, analysts know viewing this data as “declaring favorites” is junk, but don't want to admit it - because it would sink the legitimacy and appeal of their analysis. But that hasn't trickled into any published work I'm aware of, and it certainly hasn't changed the polls-as-predictions consensus.
It's one reason I believe Nick Panagakis deserves a posthumous induction into whatever the statistical and political science hall of fame equivalent is. Here's one legendary quote:
“Rules of analysis are necessary, rules that are not as shortsighted as "8 points is comfortable" and "2 points is a close race."
He knew - or at least strongly suspected - FIFTY YEARS AGO that the standards by which polls were judged were problematic. My research, half a century later, verified it.
And yet, though he argued convincingly in defense of better rules of analysis, where I believe he erred was in assuming he and others in the field shared a common understanding about what “accurate” polls measure in the first place. I have stopped making those assumptions because their words and analysis prove they do not.
Consider the following, which I offer as the “textbook” example in my book:
Poll 1
Candidate A: 46%
Candidate B: 44%
Undecided: 10%
Poll 2
Candidate A: 44%
Candidate B: 46%
Undecided: 10%
Population at the time of polls (true value):
Candidate A: 45%
Candidate B: 45%
Undecided: 10%
Here, both polls have a tiny, but equal error. Indisputable. Given a population of 45-45, a poll estimating 46-44 versus 44-46 is literal chance.
And yet, due to the fact that every election will have a winner, one of these polls will be viewed as superior to the other.
Election Result:
Candidate A: 51%
Candidate B: 49%
Here, Poll 1 would be calculated as having zero error: “up by 2” in the poll, “won by 2” in the election.
Poll 2, by the same calculation, a 4-point error.
Two polls with - properly measured - small errors, equally accurate in sampling the population, being viewed this disparately, solely due to random chance. Poll 1 estimated that “Candidate A” was slightly ahead, despite the reality that A and B had equal support. Then, due to 60% of undecideds favoring Candidate A, boom, 0 error. Sorry, Poll 2, you guys were really bad this year: better fix your methodology! Is this good science? You tell me. Because it's what currently passes for science. I won't get into the fact that pollster reputations are being made or broken - jobs gained and lost - on the back of this metric.
My proposal to judge polls based on how well they estimate the population as it was at the time of the poll - the Simultaneous Census standard - controls for this. It accounts for confounders like changing attitudes and undecideds breaking in a way that conflicts with our precious assumptions, which current standards do not.
And it all starts with understanding ideal polls: what would this tool measure in ideal circumstances?
We can test it. It's not hard. Repeated samples from a static population. Incorporate “undecided” options that are either “A” or “B” but unknown to the person conducting the poll, until some future time. Incorporate the fact that “A” supporters sometimes switch to “B” and vice-versa. Incorporate “C,” “D", and “E” options, if you want!
Let me tell you what will happen:
You will find that, by the Ideal Poll construct, repeated samples fall within the margin of error as often as the confidence interval dictates. And that by the current “election result” standard, you will get sloppy, noisy, unscientific conclusions. This could all be fixed tomorrow by adopting these standards, because it's not hard. But it's harder than subtracting poll margins from election margins. The output of that calculation producing a number doesn't mean you've solved the problem: plugging numbers into a formula doesn't matter if you don't know what the output means, or you use the wrong formula. Recently, my student who calculated the volume of a cylinder using the formula for the volume of a cone didn't argue with me when presented with that fact, nor did he dismiss my correction since he was “kind of close.” He had enough integrity to admit his mistake after being presented with it. Do you? Every passing year students are miseducated, and every election the public misinformed.
“Ideals” in any field, whether ideal gases, ideal lenses, or any other, are not intended to be absolutely perfect representations of every possible real-world application, or any real-world application. They are useful constructs for clarifying principles. They are reference points, a benchmark, a baseline that strips away the extraneous so we can understand the essence.
Indeed, ideal gases and ideal lenses are, unlike ideal polls, strictly theoretical constructs. That doesn't mean they are useless. For learners, they are indispensable. Without the ideal gas law, we would have no way to understand or teach how gases deviate under pressure and temperature. Without the ideal lens, optics would lack the baseline needed to describe distortion and aberration. This problem in inferential statistics is not conditional: in the absence of ideal polls, there is no baseline at all. Without them, we cannot know whether observed deviations come from random sampling error, which is expected and measurable, or from flawed methodology. They are conflated. The result is a century of confusion, where practitioners mistake noise for signal and congratulate or condemn polls based on nothing more than how well their snapshot predicted the race result.
That is why the Ideal Poll is not a luxury, nor an abstraction - it is the foundation. Without it, there is no science of polling, only storytelling that happens to include numbers.
Looking back at my arguments with otherwise reputable scientists, it's the equivalent of a student getting frustrated with a teacher about a CO2 versus helium calculation - where the student insists the ideal gas law is strictly theoretical, therefore the problem serves no use to him. He's smart enough to study real gases. The overlooked point is that ideal gas law doesn’t “fail” because gases in the real world deviate from it - it succeeds because it gives us the appropriate framework to measure and interpret those deviations.
The same is true for the ideal poll. Its power is not in describing every messy detail of reality, of which there are many in political polling applications. The value is defining the standard that random sampling promises, which the field currently lacks. In the absence of a standard, the election result serves as a deceptive placeholder. Only by knowing the proper standard can we meaningfully recognize when a real poll is functioning as expected, and when it has failed. Only by knowing the proper standard can we recognize that undecided voters sometimes break in a way that allows someone “behind” in polls to eventually win, and not instantly conclude “polls were wrong.” It allows us to differentiate between polls failing and analysts failing.
Want to talk to me about my research, book, or goals? Contact me.
Want to support my work, and understand polls better than experts? Buy my book.
Tagging some people, would appreciate you sharing or chatting about my work.