I know I say it all the time, but I’m going to keep saying it until it’s common knowledge: polls and poll averages are neither predictions, projections nor forecasts. They are an estimated base of support.
Polls and poll averages can inform forecasts, but they are not forecasts.
That might sound obvious to you - whether because you follow me or some other reason - but when the field's experts all think they are forecasts…and Emerson College (yeah that Emerson) publishes a paper like this…
Forgive me for reiterating everytime I write that polls aren't predictions.
Why were these photographers so far off with their prediction?!
The girl in orange won, so the snapshot must have been wrong.
Anyways.
As you probably know, all seven swing states are within reach for both candidates. Either could win all seven. No, that probability is not as high as 40% like Nate Silver said (or 50% like this guy), but either candidate winning by a decent electoral margin is in play.
But - spoiler alert - it’s still not a tossup.
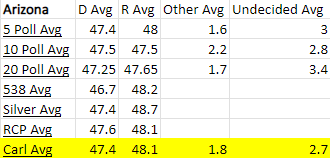
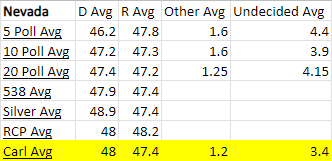
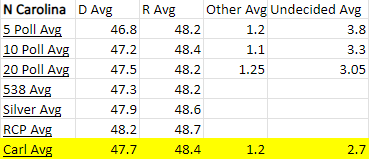
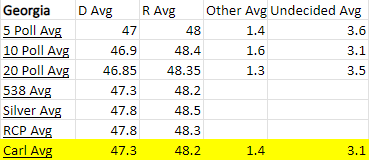
Here are my poll averages compared to some others.
First, the swing states. Starting with the “blue wall.”
Pennsylvania
Michigan
Wisconsin
Sun Belt Swing States
Arizona
Nevada
North Carolina
Georgia
Here are all of my poll averages in one chart:
While Harris is no longer touching or beyond 49% in the Blue Wall like in the last update, we’re talking tenths of a percent in movement. Because of that, her win probability that was creeping upward in my forecast has since crept downward - basically to where it was a few weeks ago.
Remember, my poll averages directly limit the influence of partisan pollsters and flooding. But there have only been about 10 polls since the last update, roughly half of them partisan, varying by state.
If Harris doesn't get back to the 49% range, but stays over 48%, it will trend downward closer to the election (approaching 60%, though probably not that low). If she gets closer to 49%, it will stay basically flat, or trend slightly upward. If it clears that range in the blue wall states, but especially so if she gets close to it in GA and/or NC, it will climb upwards (approaching 75%).
While you probably don't follow me for poll averages, understanding how they work is one of many important lessons: why they exist, what they mean, and what they don't mean.
Forecasts
Here is my updated forecast (66% chance Harris wins) comparison with FiveThirtyEight (53%) and Silver (53%).
There's not strong evidence that the race is merely a tossup: the assumption that undecideds will split strongly in favor of Trump is the only way to get there, and it's a bad one based in hindsight bias.
The Cone of Uncertainty
I imposed the cone of uncertainty on each of the three forecasters from their initial forecast point.
The logic behind the cone of uncertainty is this:
Barring any unforeseeable/rare events, a well-calibrated forecast should usually stay within it.
Even a perfectly calibrated forecast could move a few points up or down in a day, but you'll notice the cone gets quite wide towards the end: because your forecast moving 20% either direction over a two month period isn't necessarily bad. But 20% in a week because of…a convention? Well…u ok, Nate?
Here is what my forecast looks like as a range of Electoral College outcomes
That tall bar is a little misleading for Harris, because there are lots of unlikely combinations in there, along with two of the most likely (a repeat map of 2020, and a repeat map of 2020 with North Carolina possibly replacing Georgia).
The weird tie maps (3 realistic combinations) combine for about a 1/500 chance. We won't talk about those.
The 4 most common Electoral Vote outcomes remain:
Harris 319
Harris 303
Harris 276
Harris 292
Though any of these exact combinations are somewhat unlikely, they come up most often.
All of Trump's victories require a blue wall crack.
The most common losing maps for Dems in my forecast have them coming up short with 266, 247, 260, followed by 226 and 241 Electoral Votes. In my forecast, Trump’s most common victory is not winning all 7 swing states, like Silver’s and others.
The reason gets into the range of popular vote outcomes. While Trump can win (33% is pretty high) most of his wins are very narrow in the popular vote of any given swing state, meaning the odds he doesn’t win all of them is pretty high.
The Electoral Vote cutoffs in the presentation above aren't arbitrary here. I identified these bins for a reason.
Dems getting fewer than 226 Electoral Votes (Republican landslide) would require them to lose one of New Hampshire, Virginia, Nebraska's 2nd District, or some other stretch for Trump. 5% is a little low for those outcomes alone, but my forecast also allows for Trump to win one of them (say, New Hampshire or Nebraska-2) but not win a state like Nevada, Michigan or even North Carolina.
On the other tail, Dems getting to 388 (Dem landslide) basically requires Texas AND some other combination - the simplest of which would be Florida, but fairly unlikely. I think that alone might be higher than 2%, but … too many other weird combos complicate that math. So I just let the forecast do its work.
Tails matter to forecast accuracy, but landslides beyond the 7 swing states are not very likely.
My forecast has Michigan as the strongest of the blue wall states, followed closely by Pennsylvania. If the blue wall cracks, I believe Wisconsin is the most likely culprit.
While the three blue wall states almost always go together, in a close election, 1 or 2 points is the difference between a blue wall and crack(s) of red.
And in a close election, losing a blue wall state doesn't mean losing the election.
This is probably one reason (of at least two*) why my forecast is higher on Harris than others: in the event the blue wall is close, and only Wisconsin (10 Electoral Votes) goes red, any of Arizona (11 EVs), Georgia (16 EVs), or North Carolina (16 EVs) alone could patch it. While correlated, narrowly losing Wisconsin alone (but narrowly winning PA and MI) still leaves NC and GA as near-tossups, and Arizona isn't lost.
You can see why Pennsylvania with its 19 Electoral Votes is so vital.
It would take both of North Carolina and Georgia to repair a Pennsylvania & Wisconsin crack. Again, not impossible, but an election like that will leave most of us somehow less sane.
If only Pennsylvania cracks, Nevada plus North Carolina or Georgia would seal it.
In short, while we can all agree Pennsylvania is the most important state this year, making sure to do what we can to win states beyond the blue wall is still very important.
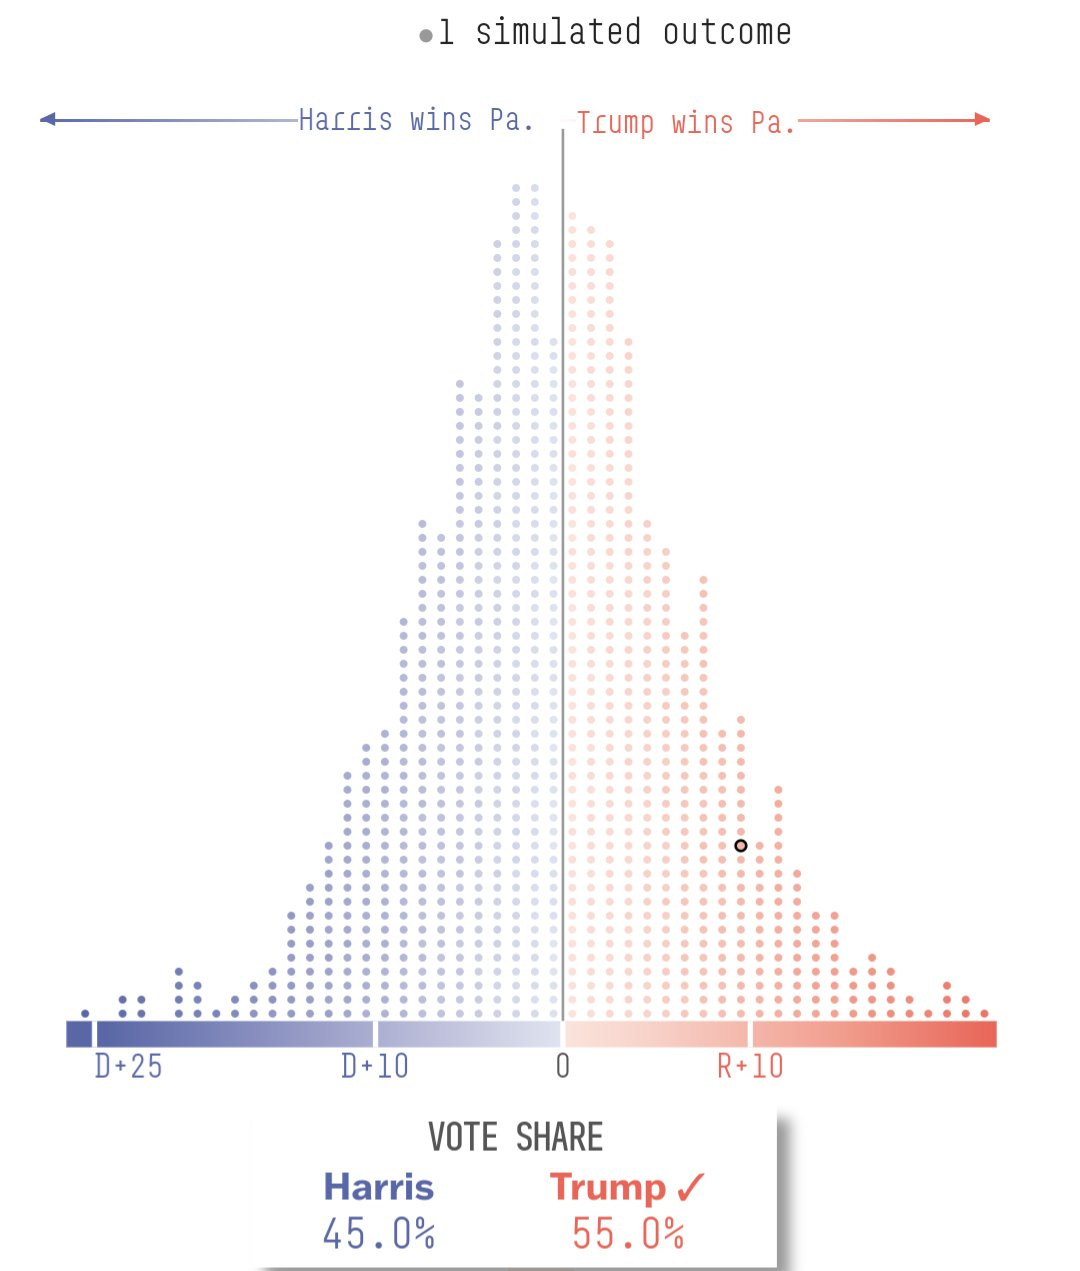
* The second is that I don't assume a uniform distribution of outcomes for Trump. FiveThirtyEight (and every other forecaster) plugs some averages into their model, prices in uncertainty under a bell curve, and it spits out something like this:
This works for lower-data events. But Trump has run for President twice. We have numbers from real elections, plus poll data showing the electorate is still highly divided. It's very rare, historically, which means using a historically-calibrated model is analytical oversight.
If someone has run two 40 yard dashes in the past year, first at 4.88 seconds, second at 4.94 seconds you can confidently say the probability they run the third at 4.6 or 5.2 is much lower than if you had only known the first was 4.88.
We can confidently say Trump isn't over 10% get 55% of the vote in Pennsylvania.
Popular Vote Visual Explanation
Below is the range of likely (and less likely) popular vote outcomes.
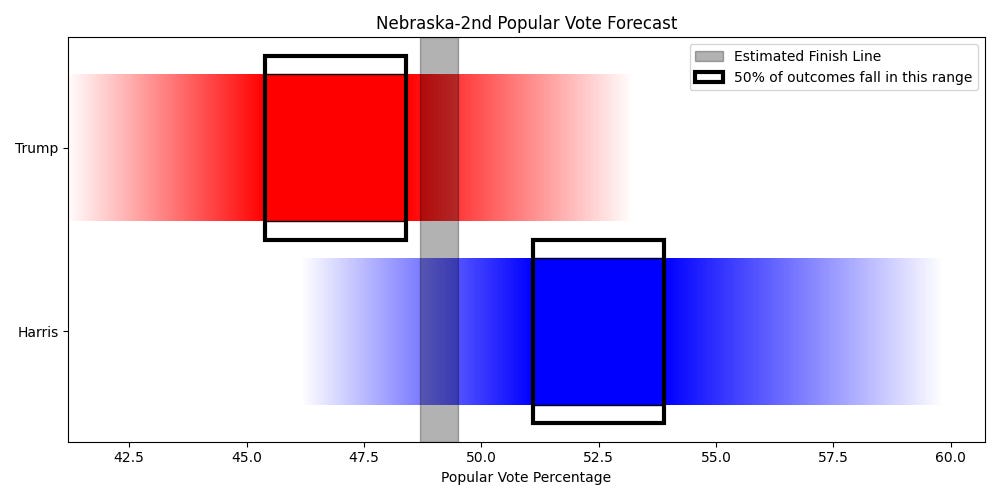
The colored bars represent slightly more than 95% of simulations, with the black box showing about 50% of the simulations.
Note about “50% of simulations” - races are correlated. It doesn't mean that I'm forecasting about half of the races finish within it. It's far more likely almost all do or almost none do. If my forecasts are decent, given a sufficient number of forecasts, about 50% will fall within it: not too many more or less. Likewise for the 95% range.
The “finish line” visual
Of my (bragging) hopefully many contributions to the field - and to the public - the finish line concept is high among them.
In short, in any race where the most votes wins, 50% of votes (plus one) equals victory. Of course!
That seems obvious, but some people think “50% is just another number.” Right.
But for people who understand how math works, we understand that while 50% + 1 guarantees victory, many races have third parties.
The “finish line” (percentage of votes that guarantee victory) is defined as half of the votes after accounting for third-parties.
(The “estimated finish line” can also refer to a raw number of votes, if you're forecasting turnout)
Either way, it means that if you're forecasting, using “spread” or how much someone is “up by” is pretty useless:
Not all races have the same projected third-party vote.
If a candidate needs 50% to win, versus 49%, versus 45%, versus 40% (yes, it happens) that has an enormous impact on win probability.
A poll average of 43%-37% isn't strong for a projected finish line of 50%. It's remarkably strong for a projected finish line of 40%.
Forecasting win probability is not calculating “probability(finishes with positive spread)” - though many bad forecasters do this - you're calculating “probability(receives enough votes to win).”
You'd be amazed at how different these calculations are.
It's hard to believe a candidate “up by 8” could lose - though I've seen polls with candidates up by 8 who I did not even consider the favorite - largely because 43-35 “up by 8” is not even in the same mathematical universe as 53-45 “up by 8.”
But to people who should have their work graded “F,” a poll that says “43-35” (with 22% undecided) with an election result of “48-52” means the poll was “off by 10.” No other possible explanation, no sir, just a bad poll.
Dumb.
Another line I've said a million times, and won't stop until the field stops making the same “spread” mistakes: all else equal, a poll average of 49-46 has a far higher win probability than one of 46-40.
Just in time for this post,
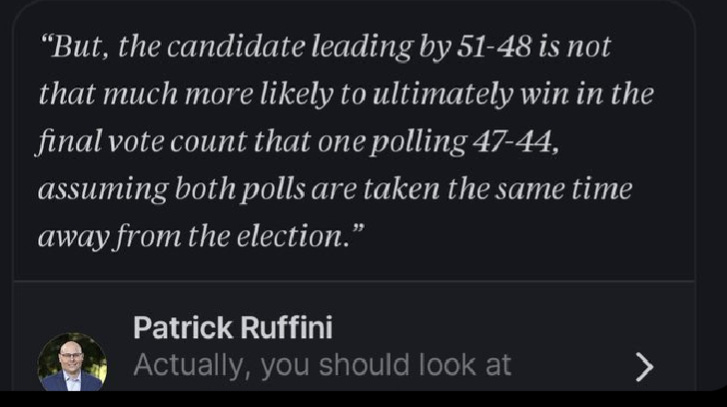
(Echelon Insights pollster) just claimed that 51-48 is “not that much more likely to ultimately win” than one polling 47-44.He tagged me in the post, and referred to my book - which he clearly hasn't read.
51-48 is basically the same as 47-44 because spread?
Damn, if only someone had tested this.
So now, Patrick can either provide evidence to support his position, or concede that he can't, or that he is wrong. Those are the only options. I look forward to him not responding.
The finish line visual provided in each state below is my approximation, based on forecasted third party votes. Some states have more uncertainty around that calculation.
Pennsylvania (68% chance Dems win)
Michigan (66% chance Dems win)
Wisconsin (63% chance Dems win)
Arizona (44% chance Dems win)
Nevada (67% chance Dems win)
North Carolina (46% chance Dems win)
Georgia (44% chance Dems win)
Important to remind people: although Democrats are slight underdogs in AZ, NC, and GA, does not mean that the most likely outcome is Dems winning where they're favored and losing where they're underdogs.
This exact outcome (Dems with 276 Electoral Votes) is only the 3rd most common outcome in my forecast - with little separation between 3rd and 10th. Winning all of the swing states or all but one is more likely.
The Stretch States
In no particular order, here's the same popular vote forecast for some states (and a couple districts) that could feasibly flip in a borderline or actual blowout. “Stretch” spans from about 5% win probability to 25%.
Minnesota (89% chance Dems win)
Florida (15% Dems win)
Virginia (92% Dems win)
I'm posting this early because I got a little distracted
I'll keep editing and updating periodically
Texas (12% Dems win)
Nebraska-2nd (85% chance Dems win)
Maine-2nd (22% chance Dems win)
Colorado (94% chance Dems win)
New Hampshire (88% chance Dems win)
Maine (92% chance Dems win)
Alaska (8% chance Dems win)
Ohio (10% chance Dems win)
New Mexico (88% chance Dems win)
New Jersey (95% chance Dems win)
South Carolina (5% chance Dems win)
Iowa (10% chance Dems win)
The Solid States
Barring something very crazy, these states won't flip. The probability for some is higher than others, but all are under 5%.








I read you from Europe and I am fascinated by your work ( I bought your book few days ago - still not read). Here most of the electoral systems are proportional with (many) more than 2 parties: how does the science of polls change? Is it still a game mostly played by the undecided?
You have Trump leading 48.4 - 47.7 in NC, with 2.7% undecided, and a 54% Trump chance. Then you have Harris leading 48.1 - 47.4 in Michigan, also with 2.7% undecided, but your win probability for Harris is 66%.
Would be nice to know a bit more about your assumptions with undecideds, because unless I'm very much mistaken, your forecast predicts undecideds to break Harris.