


The Simultaneous Census Standard
A Small, Beautiful Explanation

The consensus definition in the field of inferential statistics with regards to measuring “poll accuracy” is to compare a poll or poll average to the election result.
Pew describes the election result as an “objective standard” against which survey accuracy can be compared.

Nate Silver brought this standard for measuring “error” from academics to mainstream at FiveThirtyEight.
Other sources say the election result can be taken as the “ground truth” against which poll accuracy can be measured.
The American Association for Public Opinion Research (AAPOR), British Polling Council (BPC) and every other country's authority I've read accepts this a priori.
As does Pew, Roper Center, and Statistics Societies around the world.
All in all, it's not disputed or disputable that poll accuracy is presently calculated by how closely it aligns with the election result.
This article will disprove the current standard, establish the correct one, and properly understood, will immediately lead to better research and new methods of analysis.
Preface: The Flawed Foundation of Poll Analysis
It's worth mentioning, though it may sound hard to believe, there is no consensus in the field about what the “observed value” is in a poll, or even how to measure the election result.
I wrote about this problem (and probably solved it) elsewhere but no one cares about it because the much simpler, much more important problem remains unquestioned.
Not questioning that foundational assumption (polls, if accurate, will predict election results) leads to not questioning - or even being able to question - the analysis done that is built upon it.
It's analogous (if far less impressive) to solving the problem of “Why does Mercury’s orbit stop and then reverse direction?”
It appears to, from Earth, but asserting that Mercury’s orbit stops and changes direction is built upon the a priori assumption that Earth is stationary.
Understanding why “Mercury in retrograde” isn't an accurate representation of planetary motion only makes sense if you understand, or at least accept the possibility, that the foundational assumption (Earth is stationary) is wrong!
That is exactly why the Ptolemaic model of the universe was accepted by otherwise brilliant scientists for thousands of years.
When you assume an answer is already known, your analysis shifts from inquiry to justification.
That is not good science.
In the case of geocentrism, they used deferents and epicycles to explain their observations, and it happens the math mostly works…
Until the math doesn't work, after which more epicycles are added, and equants are postulated, all to make the math work again.
Repeat.
Instead of considering the possibility that the foundational assumption is wrong, and inquiring as to why the original model failed, the new observations are justified to fit it.
Here's why that matters, and how it relates to analyzing poll data:
The Uncontested Consensus: Polls Are Literally Predictions of Elections
“Polls underestimated Trump again” was the consensus at this year's AAPOR conference (so I'm told), and it is stated plainly by some of the field's best analysts.
Polls didn't predict how much he would win by, therefore they underestimated him, they say.
Again, this polls-as-predictions representation of the field's consensus is not disputed or disputable, but just for due diligence here are a few references of countless examples of notable sources.
The quotes (emphasis mine):
The Marquette Poll "predicted that the Democratic candidate for governor in 2018, Tony Evers, would win the election by a one-point margin." -G Elliott Morris
"Up through the final stretch of the election, nearly all pollsters declared Hillary Clinton the overwhelming favorite" - Gelman et al
The poll averages had "a whopping 8-point miss in 1980 when Ronald Reagan beat Jimmy Carter by far more than the polls predicted" - Nate Silver
"The predicted margin of victory in polls was 9 points different than the official margin" - A panel of experts in a report published for the American Association of Public Opinion Research (AAPOR)
"The vast majority of primary polls predicted the right winner" - AAPOR
All (polls) predicted a win by the Labour party" - Statistical Society of Australia
"The opinion polls in the weeks and months leading up to the 2015 General Election substantially underestimated the lead of the Conservatives over Labour" - British Polling Council
The Red Flag That FiveThirtyEight Missed
When equants and epicycles were piled onto one another, inquiring scientific minds would ask:
“Why does this model that we use keep failing?”
But if you don't stop to question the foundational assumption, it's easy to mistake the poor ad hoc work for, let's say, model refinement.
That is precisely what has happened, and is happening, in this field.
With the benefit of hindsight - new observations - the model is simply backfilled and claimed to never have been wrong.
The hypothesis that how much someone is “up by” in a poll or poll average can be converted to a win probability is perfectly reasonable, if you believe that polls are predictions of the election result, and that the “spread” (how much they're “up by”) is an accurate reflection of the data given by the poll.
Well…
Here is what Nate Silver produced at FiveThirtyEight in 2012. Please read the highlighted portion at least:

To be clear, and fair, he does not say that “up by 2.4 has historically meant 82% win probability…therefore 82% win probability”
He does say, however, that this observation supports his (or his model's) conclusion for a 76 percent chance.
Which is to say, the regression analysis wasn't the model…but it clearly informed it.
So far, no major red flags, just some historical data influencing a model.
Again, please read at least the highlighted portion below. In that same article, he said:

He didn't say it couldn't happen. He just said it was extremely rare, and his model was cautious. Still, no (major) issues.
His conclusion, which was a big catapult for his reputation when Obama won Ohio and the election, considering the prevailing “tossup-ish” perception:
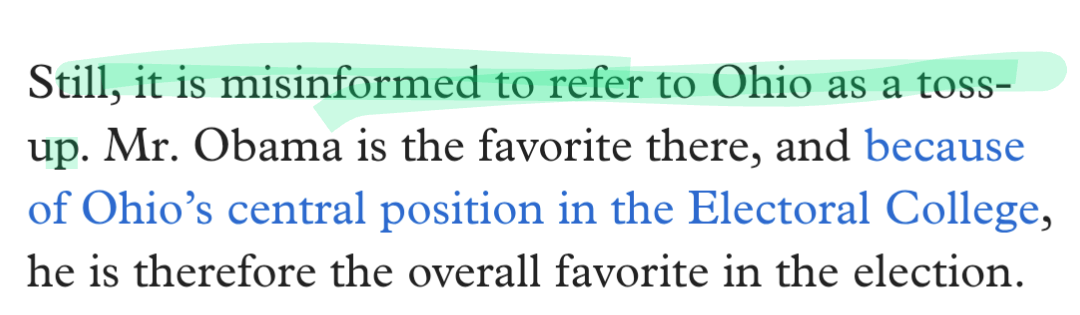
“It is misinformed to refer to Ohio as a tossup.”
Reiterated for a reason.
Say, FiveThirtyEight, what's the win probability of someone with a 2.4-point lead in the polls?
Whoa.
Very recently, they said a 2.4-point lead is about an 82% win probability.
And that same analysis 10 years later says you need…like…an EIGHT POINT LEAD to hit the same threshold?!
🚩🚩🚩🚩🚩
It's deferents, equants, and epicycles all over again.
Worse than the revisionism, in my opinion (and why my tone is more combative than academic at times) is this:

2012: Leading by 2.4 points is like 82% to win…it is “misinformed to refer to Ohio as a tossup” because “up by 2.4” is very strong.
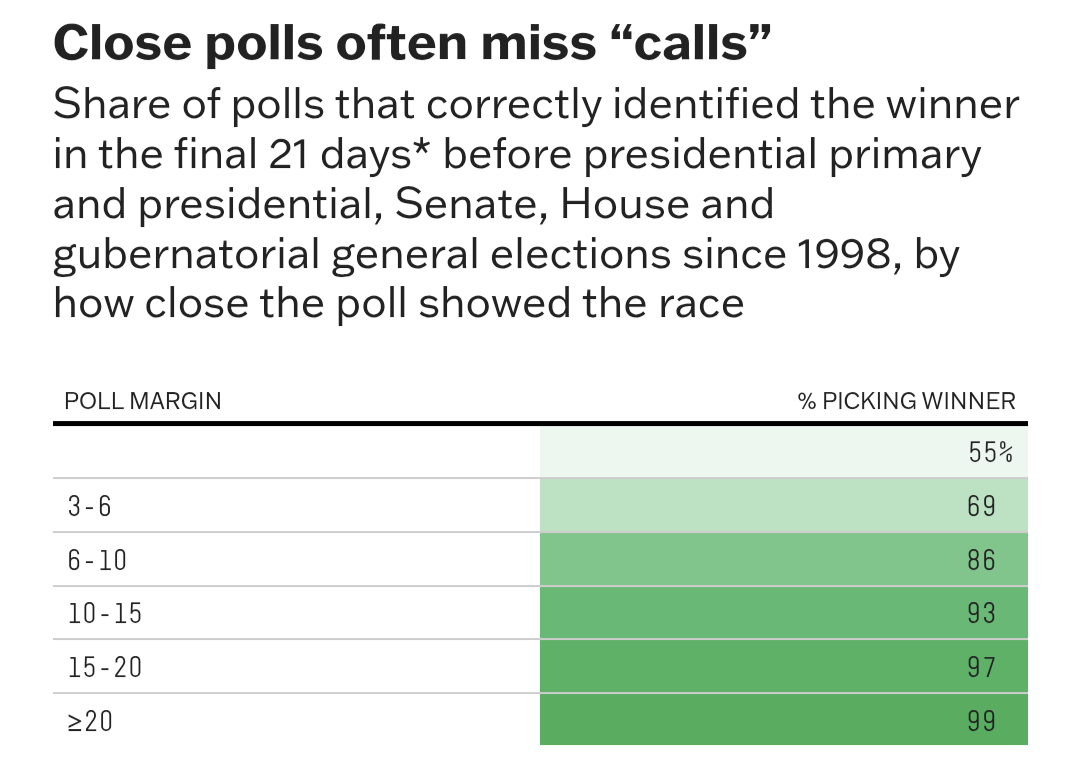
2023: “races within 3 points in the polls are little better than tossups…something we've been shouting from the rooftops for years.”
It's bad enough that this poor analysis observing spurious correlations is not given serious critique - but is published, consumed, and accepted by otherwise respectable analysts.
But to PRETEND “oh we've always said this” (implying that your work predicted what you observed only in hindsight)…unacceptable.
There is no shame in being wrong, especially when you're performing novel or challenging analysis. But refusing to admit it, revising your analysis, all while claiming it's been right the whole time?
That should be disqualifying scientifically. And professionally.
There is no statistical insight being offered here - only revisionism.
The issue isn’t that the “82%” model got it wrong.
Or that the “55%” model did.
Not only is it not right, it's not even wrong. It's a nonsensical calculation.
The issue is that it relies on the same broken logic that has contaminated the field since Literary Digest and Gallup - treating polls as predictive rather than inferential, using “lead” as a proxy.
It happens that the statement “(insert lead here) yields - even approximately - (insert win probability here)” is as nonsensical as “Mercury's orbit stops and reverses.”
Bless your heart, I truly believe that's what you saw. I know you saw a 2.4-point lead yield an 82% win probability. And I believe you later saw that same lead be a “little better than” tossup.
What you see is not always the whole picture.
They're mistaking appearances for mechanics. Because they're assuming an invalid frame of reference.
At some point, good scientific minds need to take a step back and ask themselves:
Why do we think this? Might we be wrong? What assumptions are we taking for granted?
The assumption that polls are predictions of election outcomes, like the assumption that the Earth is stationary, feels perfectly reasonable.
There is no statement of intelligence or education to be made about people who make/made those respective assumptions.
However
If you study the topic, and your model starts producing contradictory conclusions…you must consider the possibility that the model is wrong.
No one else in this field does this, or (in my experience) is even willing to do this right now.
The “geocentric” (or spread-centric) model is, to current practitioners, not just “good enough.” It is right.
If you treat election outcomes as the fixed frame - the ground truth polls are supposed to predict - you will be left incapable of modeling reality.
FiveThirtyEight’s original “lead-to-win probability model” failing wasn't noise. It was a signal that the wrong center is being modeled.
The only reason I pick on FiveThirtyEight specifically and not academic publications (of which there are many flawed pieces, all of which make these same assumptions) is because FiveThirtyEight and Silver's work have exercised disproportionate influence on both academics and the public.
Now, I haven't proven a thing regarding my findings yet (at least, not in this article), so all I'm hoping to establish is that you accept, with some amount of confidence, that there is a problem with this current system, you understand what the field's current consensus is, AND
That if there is a problem, it should be fixed.
Statistical Definition of Error
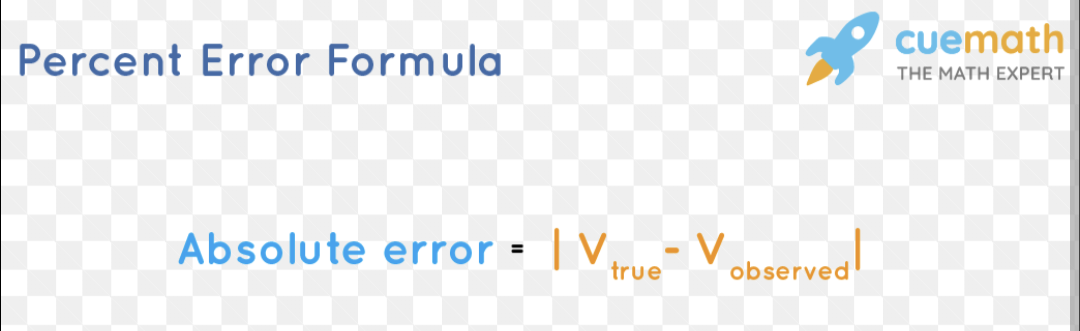
Again, not disputed or disputable.
The true value minus the observed value equals (absolute) error.
I mentioned previously that analysts around the world have different values they use for the true value…and also the observed value…
(And those values are contradictory, 🚩🚩🚩)
But I'm gonna stay on topic for a change, dammit. One thing at a time.
Those analysts all agree that the election result is the “true value.”
Not exaggerating or abbreviating:
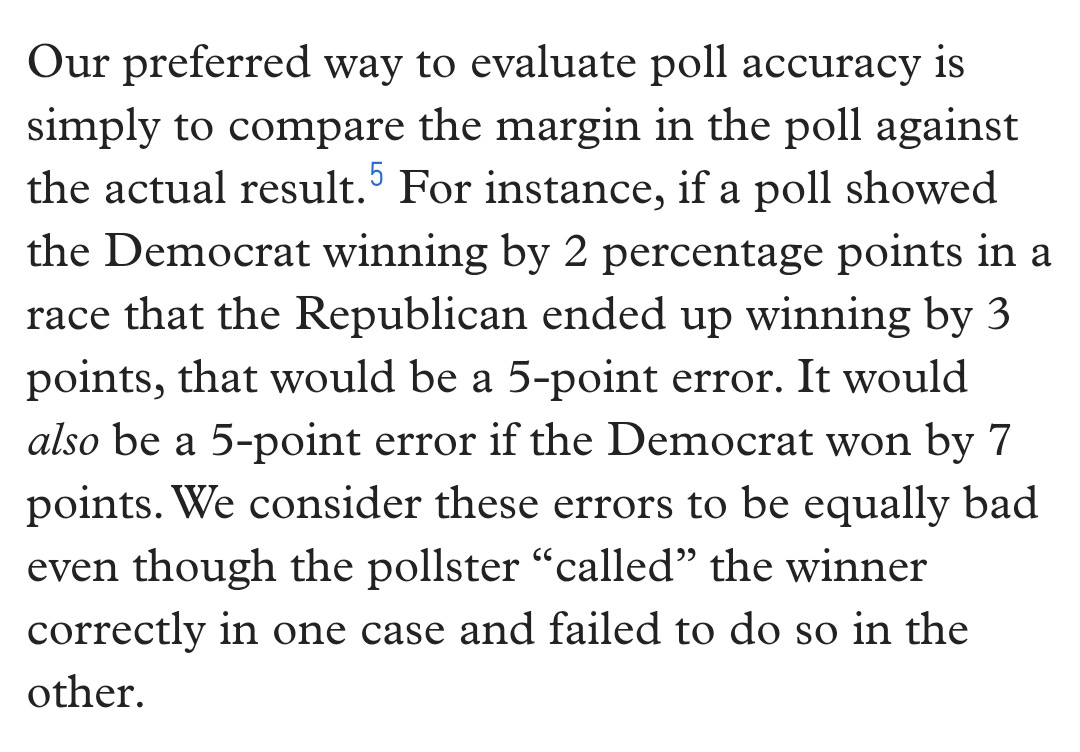
Current analysis says that if a candidate who was “ahead by 2” in a poll or poll average eventually “lost by 2,” then the poll/poll average had a “four-point error.”
For example, a poll/poll average that observes:
Candidate A: 46%
Candidate B: 44%
Undecided: 10%
In which the election result is:
Candidate A: 49%
Candidate B: 51%
Would be analyzed as follows:
Poll/Poll average (observed value): Candidate A +2
Election result (currently accepted true value): Candidate A -2
Given the formula: true value - observed value = error
Therefore:
-2 - 2 = -4 or a 4-point error.
That's not the right answer
I will tell you the right answer, then I will prove it.
The right answer is:
Not enough information.
Looking only at the poll/poll average “lead” and comparing it to the election result requires at least two major assumptions:
No one changes their mind between polls and election (Changing Attitudes)
Undecideds always split evenly to the two major candidates (Undecided Ratio)
These are testable claims that are never true, but this reality is not considered by present analysis.
(I will not go into much depth on confounding variables in this article, I'm assuming if you've read this far, you understand what they are)
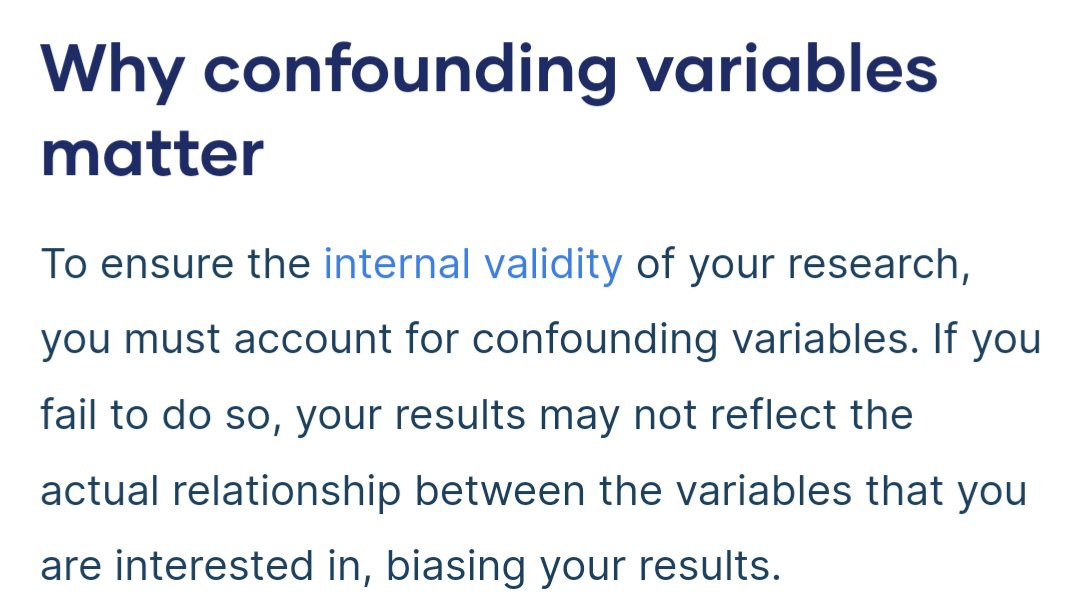
There are many valid ways to deal with the problem of confounding variables in science - assuming they are “none, negligible, or known” are not among them.
At this point, the contention is usually in regards to the fact that it seems as though I'm nitpicking about approximations and estimates.
Even if some people change their mind…how many could it be?
Even if undecided voters don't split evenly…how lopsided could it be?
Does it really matter that much?
One step at a time.
Do you agree with me - and understand - the fact that “mind changing” close to an election isn't always zero, and that undecided voters don't always split evenly?
If so, you've completed step one of abandoning the geocentric (spread-centric) model of poll analysis.
You don't even have to agree that I'm right about anything else yet, just that these confounding variables exist, and can cause the current calculations to be imprecise.
Ignoring for the moment that many polls have “undecided” in first or second place (e.g. smaller House races and primaries where candidates aren't as well known)
Remember, the claim is not that the election result is a “close estimate” (or even just a “useful approximation”) for analyzing the accuracy of poll data.
They literally say: poll spread minus election spread equals error.
They grade pollsters this way. They compare pollsters on this basis. Jobs are kept and lost on this basis. They say “who the best pollsters” were based on this and this alone.

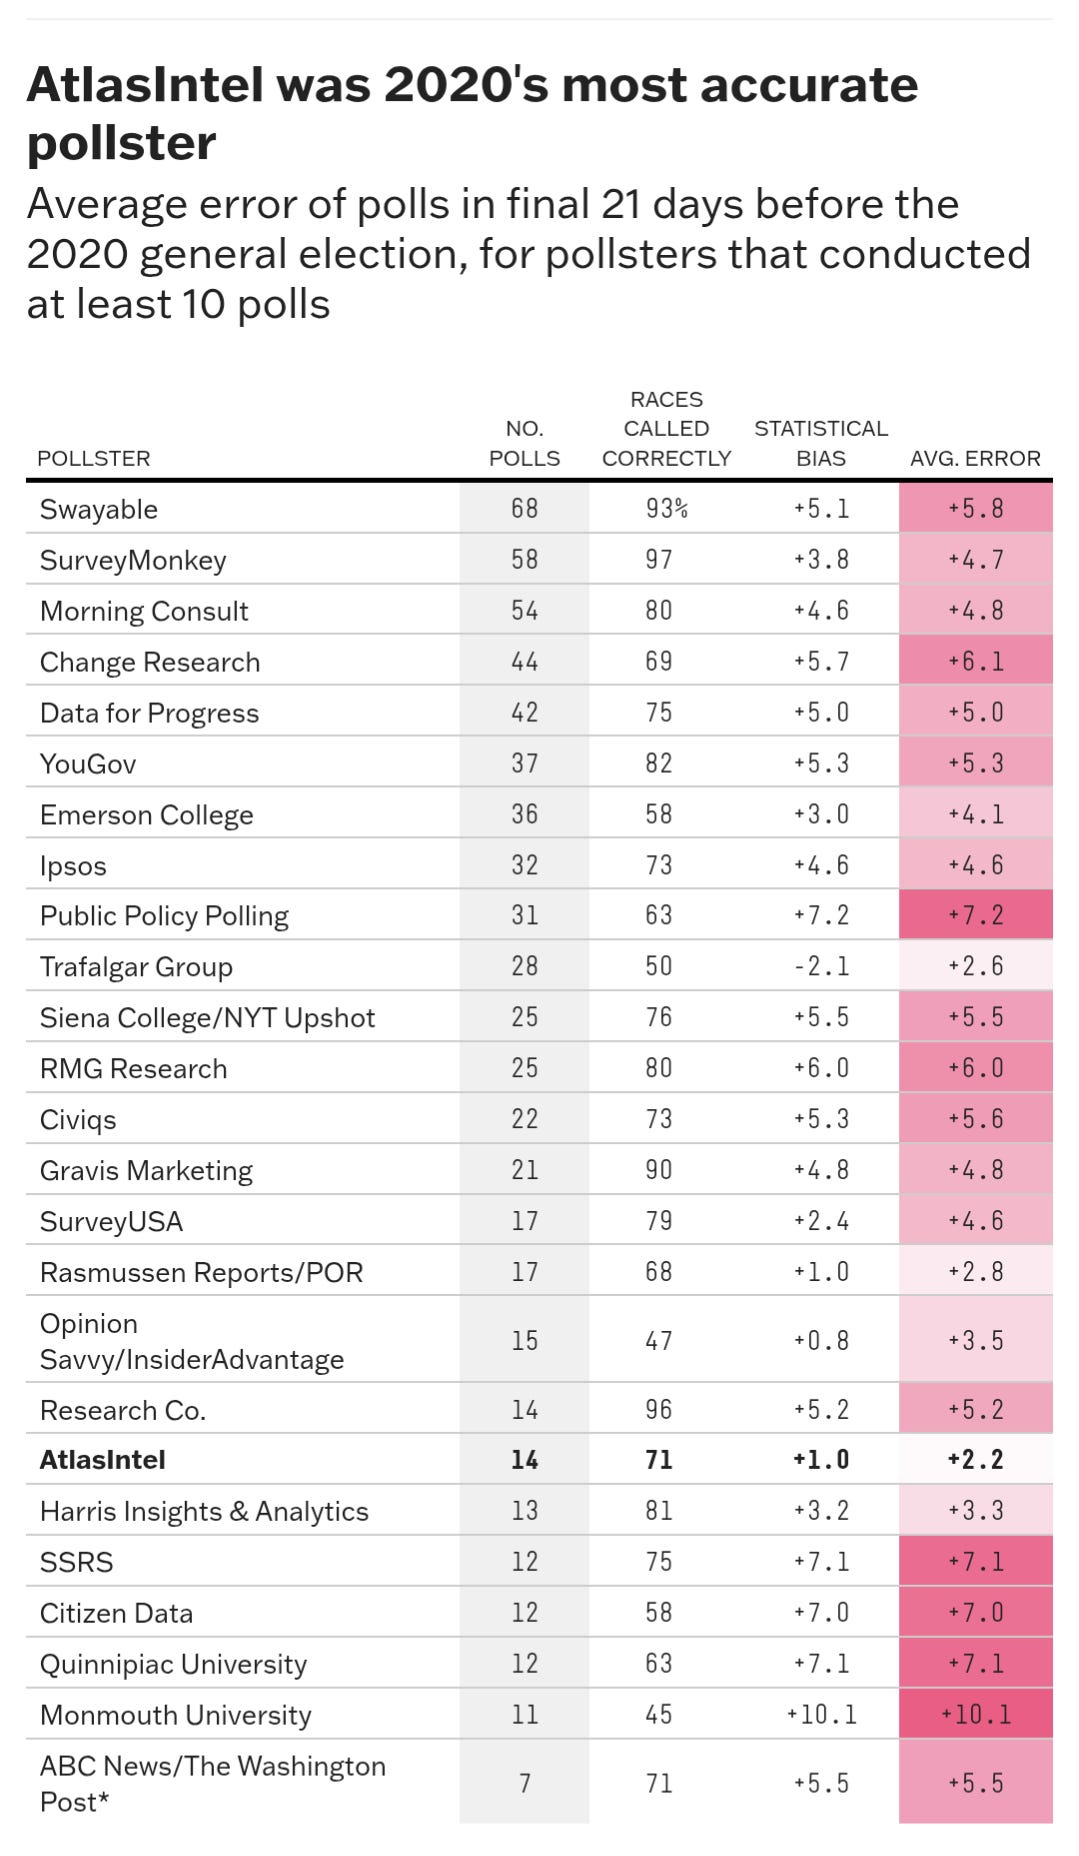
Again, citing FiveThirtyEight for sake of ease, charts like this overwhelm the contents of academic journals too.
The claim to be defended is that the election result is an OBJECTIVE one, and GROUND TRUTH for poll accuracy, not that it's “good enough” or a “useful approximation.”
If you can't tell, I've encountered this goalpost moving attempt many times with people I used to respect, and would prefer to avoid more of it.
This style of debate is the antithesis of scientific integrity and serves only to shield the current standard from falsification.
So with all that in mind, let me be as generous as possible to the current standards:
Even in elections where very few people are undecided, and the poll is taken very close to the election, confounding variables still cannot be ignored, assumed as negligible or known.
The election result may be a useful enough approximation (given the time and effort it would take to do the post-election work required to obtain much more accurate numbers) IF THE POTENTIAL FOR CONFOUNDING IS VERY LOW.
In other words, even if I weren't able to offer a better solution, or you believe my solution is inadequate, any honest person within the field must admit, at minimum, the error calculations currently employed by the field are approximate at best due to the presence of confounding variables.
In some cases that potential is high, other times low.
And whether the potential for confounding is high or low - would be great topic of debate or research - it is never zero.
Attempting to cite who “the most accurate pollster” is, in that context, makes no sense. But they do it, because they don't understand it.
Likewise for claiming how “wrong” the polls were by comparing poll averages to the result.
I don't know any respectable scientists or mathematicians who do a calculation, knowing it's an approximation at best, say, “Eh, this is good enough, sometimes” and don’t seek to improve upon it.
The most generous interpretation of this field is not that they understand “polls aren't predictions” but for some reason choose to assert they are, and do calculations that incorporate that. The most generous interpretation is that they don't understand it!
The debate about “how good of an approximation is this (provably) imprecise method?”
Cannot take place until the current standards are acknowledged to be, at minimum, imprecise. I've studied it, I've staked my position, and I'm not too proud to admit that my calculations (regarding the accuracy of past polls) could be imperfect.
But I will not debate this area of study with spread-earthers who don't even understand how polls work. For the same reason I would not expect an astrophysicist to debate orbital mechanics with someone who believes the Earth is stationary, or an epidemiologist to debate someone who believes diseases spread by ghosts in your blood.
Admitting the fact that the poll versus election spread is not a valid metric for judging poll accuracy (and the underlying “why?”) directly leads to using the appropriate frame of reference, which will instantly lead to new discoveries and inquiries among the field's brightest.
And that's what I believe science is for.
Once we've reached that point, the answer to the “how much poll error was there?” question posed above can be understood by both learners and experts as “not enough information” for a very simple reason:
Assumptions can't be used in place of data. Among other things:
How many people changed their mind between poll and election? Can we assert with certainty that it's 0?
How did undecideds split? Can we assert with certainty that it's 50-50?
Current calculations say “yes.” Not approximately, but exactly.
That's not the right answer.
Not approximately, not exactly, not at all: the amount of information given solely by comparing the poll spread to election spread is entirely insufficient to draw conclusions with any scientific level of confidence.
“Not enough information” isn't an elegant answer, and it's certainly not satisfying, but it's common and important in science and statistics.
Recognizing when a problem lacks sufficient data to support a conclusion is not a weakness - it’s a strength. It signals epistemic humility. It prevents overfitting, false precision, and unwarranted certainty.
More appropriately for this example:
Being able to distinguish between solvable and unsolvable problems illustrates fluency beyond choosing a formula and plugging in numbers - and it shows what questions need answered in order to solve the problem.
Given 10% undecided, even if the poll were perfect at identifying the respective population proportions at the time the poll was taken, and the assumption that “no decided voters change their mind” held…
If those undecideds split 30% for Candidate A, and 70% for Candidate B…
Where's the error?

This poll, by current standards, would have been judged as having a 4-point error, despite the fact that it had none.
Are you comfortable saying that a poll that perfectly estimated the population at the time of the poll was “off by 4” simply because undecided voters behaved in a way contrary to what you, or “the experts” assumed?
For the sake of scientific integrity, I hope not.
In this case, previously undecided voters splitting 30% - 70%, alone, caused this misattributed error, because the assumption that they must always split 50-50 is accepted without question.
Think a 30-70 undecided split is unreasonable or unrealistic? It's not, but again, let me be as generous as possible to the current standards.
How about 60-40?

Now, Candidate A was “+2” in the poll, but won the election by 4, entirely due to a 60-40 undecided ratio.
A poll with 0 error, properly measured, would be graded as having a 2-point error.
Now, again, many people resort to the goalpost moving thing here, “well two points pfffft nothing semantics who cares…”
No, that's not you.
The takeaway to this point isn't that the present methods would rate a poll with 0 error as having a 2-point error.
The point is that it observed a poll as having 2 more points of error than it actually had.
(This is the aha! moment for the approximately 6 people who currently value my work and see the ramifications)
A poll that has a legitimate (positive) two-point error (margin of error, frame error, nonresponse, whatever) isn't considered a big deal.
But that “no big deal” poll error that allows this confounding variable to contribute another two points… now is claimed to have had a four-point error.
Twice as much error as it actually had.
And again, this is from a mere 60-40 undecided ratio.
Now consider the fact that errors can also be negative. In simplest terms, the margin of error is known to be “plus or minus” so…
A poll with an actual (negative) two point error, with the addition of this confounding undecided ratio contributing a positive two point error…now is said to have zero error! (This is a textbook compensating error, and it previously didn’t exist as a concept in this field to my knowledge).
My proposal that confounding variables must be accounted for before poll error can be calculated (or even approximated) would not be even remotely controversial, if not for the field's traditional acceptance of this standard.
The Simultaneous Census Standard and How to Teach It
The “true value” for a poll is the target population as it was when the poll was taken. That's what the data given by a poll estimates: a simultaneous census.
Not a future value.
The fact that a simultaneous census is not known or knowable in some circumstances is irrelevant to its existence - I'm not sure why that's controversial.
You may not be able to observe all voter preferences at once, but the state of the electorate at a moment in time is still a real system with properties; it is a latent state (in political applications). And it's what polls attempt to measure.
And it's not a hypothetical, nor is it untestable.
Bernoulli used marbles in his experiment, and the true value he was attempting to estimate was the proportion of white to black marbles in the urn.
That same math informs the margin of error calculation in election polls.
However, marbles don't change color in the same way decided voters can change their election preference, and marbles can't be undecided.
Confounding variables create a clear limitation of the tool, but that doesn't mean it's not still powerful.
As long as you understand what the output means, and don't mistakenly believe that the margin of error given by a poll applies to the election outcome.
What Bernoulli did with marbles, I did with thousands of red and green mints, with an important distinction.
Unlike the binary “A/B, Yes/No, Black/White” arrangement, I made a modification to make my experiment applicable to political polls.
Some mints were covered in aluminum foil, such that their contents were unknown, until some future date. They were, with 100% confidence, either red or green on the inside - but when sampled, could only be labeled as “undecided.”
How can we know, or approximate, the future state of those foil-wrapped mints?
If you're asking yourself: “were they wrapped randomly, or could they have been wrapped by someone with a bias, or…”
Brilliant. Now ask the same questions about undecided voters, and watch yourself let the “50/50” assumption crumble.
Here is one such sample I took for my “Mintucky” experiment.

Considering there is no nonresponse error (or any other error, for that matter) except for sampling error, how can the accuracy of this poll be measured?
The options are:
Unwrap all the silver mints, then count all of the mints, and see how closely the final “Red” margin is to “+1.9.”
Count all of the mints in the bin, as they currently are: Red, Green, Silver
Option 1 is the current standard (Spread Method) and Option 2 is my proposed Simultaneous Census Standard. Which is correct?
Well, because of the fact that “silvers” are unknown, based on simple arithmetic, we can state that Option 1 simply assumes they will split evenly. One can argue that this should be the default assumption (even if there are lots of arguments against it, in both mint and political applications) but it can be granted as the best assumption for sake of argument; it's still an assumption.
Meaning, if they don't split evenly, the method has failed and misattributed the method’s error to the poll: a textbook category error.
But by Option 2, the Simultaneous Census Standard - which says the proper “true value” being estimated is the composition of Red, Green, and Silvers as it was when the poll was taken -
The poll will fall within the margin of error exactly as often as the confidence interval specifies.
It's mathematically verifiable.
The Simultaneous Census Standard is not a new idea - it’s an unspoken one. It is the implicit benchmark behind all scientific survey methodology. Naming it doesn't invent a principle; it reveals one.
And naming it matters.
Because until we teach that this is what a poll is really trying to estimate, and not allowing “true value” to be filled in with conflicting assumptions, we will keep misunderstanding what a “miss” is, misidentifying which polls were “most accurate,” and misattributing sources of error that don’t belong to the poll itself.
We reward polls who may have been lucky because they “predicted” the election result - even if their sampling or weighting was flawed. We penalize scientifically sound polls because the confounders compounded instead of compensated. It's poor reasoning, poor practice, and easily corrected.
The Simultaneous Census, though unnamed until recently, is the underlying statistical principle from which poll data derives its value. It is the number the “margin of error” given by a poll applies to - not the election result.
The term “true value” is, based on the field's misunderstandings of it, too vague. Giving it a name is just a way of trying to explain something that already exists, but is misunderstood.
Presented with the electoral reality of an unknown simultaneous census, analysts have erroneously substituted a future value in its place.
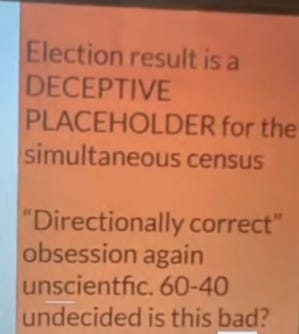
The election result is a deceptive placeholder for the proper true value. Logically, it is a “hasty generalization.”
The “snapshot” analogy
Analysts commonly - and appropriately - refer to polls analogously as snapshots.
They caution, and expound, that polls aren't predictions…but snapshots. Before the election, that is.
But then, after the election, they fall over themselves and instantly abandon their own (claimed) understanding by subtracting poll margin from election margin to calculate error.
I wrote about that here, and here.
And then with the goalpost moving, many people who argue with me about the field's standards point to any number of examples of analysts correctly stating that polls aren't predictions.
Saying you understand something is very different from demonstrating it.
Correctly defining “them” as a “direct object pronoun” does not mean you understand it. In fact, a sentence like “I like polls, them provide good data” (and arguing that this sentence is correct) proves that you don't!
Correctly stating “the Earth is not stationary,” then providing a calculation of Mercury's orbit that includes epicycles and the term “retrograde” proves that you don't.
And correctly stating that “polls are snapshots, not predictions” while providing calculations that implies, and analysis that includes, verbatim, “the polls predicted” proves that you don't. See the citations at the beginning of the article, which is a miniscule sample.
After an election, those same snapshots are retroactively judged against the final outcome - as if they were forecasts.
Better methods, luck, or a blend? No one knows. And no one cares. They can't know, because they're assuming a stationary Earth.

The casual dismissal of methodology as a decisive factor and defense of a possibly unscientific pollster because they are kind of close to the election spread sometimes illustrates my point perfectly.
Silver's replacement at FiveThirtyEight fares no better, comparing a highly transparent, scientific poll to a notoriously unscientific one.
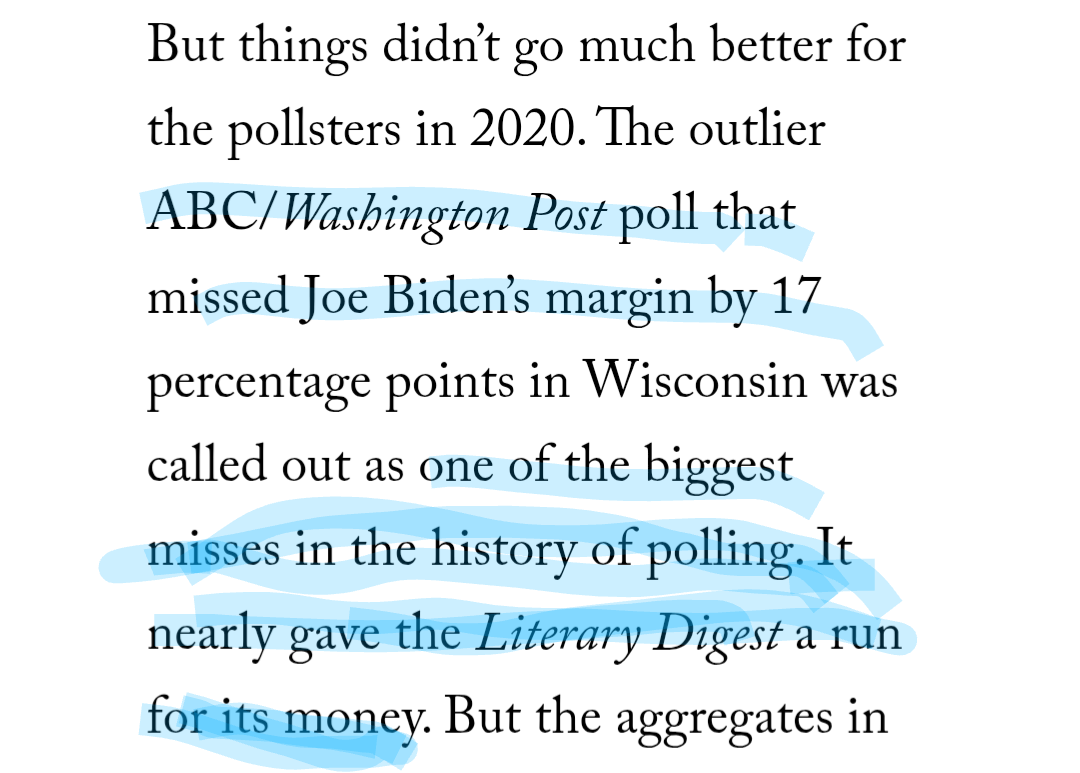
It's clear - to analysts in this field, “closer to result” means “better.”
That's all they care about, as it pertains to measuring accuracy. And that's how they inform the public, too. Statistical literacy is suffering from this deterministic mindset.
To sum up this section:
No one who states, or whose calculations imply, “the polls predicted…” or “the polls underestimated…” has a complete understanding of how polls work, and what they measure. That analysis requires believing that polls, if accurate, will (and must) predict the election result; that's not correct.
I know that comes across as combative, but it's true. And until that's fixed, this field will remain stagnant.
How To Improve Statistical Literacy for Educators, Teachers, Learners:
While the snapshot analogy isn’t a perfect analogy, it's a fine starting point.
For people who are not comfortable with numbers (and even those who are) start here:
“Who does this snapshot predict will win the race?”

Most people quickly see the irrationality of that question. Snapshots, obviously, aren't predictions.
But this snapshot, certainly, gives us valuable information. How valuable? What else would we like to know?
Good questions to discuss. The analogy works better than you may think in applications to poll data.
Think: is it better to be “up by two meters” very close to the finish line, or halfway through the race? Are they equivalent?
What about “up by 2” close to the finish line, or “up by 4” farther from it?
(Polls of 46-44 with 10% undecided are so dissimilar from polls of 50-48 with 2% undecided I'm not sure you'd believe me even if I proved it. Likewise for 49-47 vs 46-42).
Contrary to popular belief, 50% is not “just another number” in polls.
Now, back to the snapshot example, let's say the runner in front is “up by 2 meters.”
But in the race result, the runner in orange wins by 2 meters.
Would it be logical to state, therefore, the snapshot had a four-point error?
Current standards used in this field say yes; again indisputable, it’s the literal definition used for error.
Of course, the snapshot’s accuracy can only appropriately be measured by how accurately it presented the runner's position at the time it was taken.
In this case, each runner's true position at any given point in time can be known, but in elections, a candidate's true support at any time before the election cannot be known, hence to referring to the election result being a “deceptive placeholder.”
For learners, this snapshot analogy introduces “confounding variables” and “simultaneous census standard” without even naming them.
And it reiterates for the field that if you want to demonstrate understanding of the “polls are like snapshots” analogy, act like it.
Here's something that might help:
What Should Become the “Textbook” Poll Accuracy Example:
Consider two competing polls: Poll 1, and Poll 2.
They are taken at the same time, same methodology, etc. etc. - call it “all else equal.”
Poll 1:
Candidate A: 46%
Candidate B: 44%
Undecided: 10%
Poll 2:
Candidate A: 44%
Candidate B: 46%
Undecided: 10%
Election Result:
Candidate A: 51%
Candidate B: 49%
Which poll was more accurate?
Answer: Not enough information.
This is the only right answer.
No, you can't state (even probabilistically) which poll was more accurate.
And even if you could, which you can't, you still don't know.
This fact is problematic for the field's current standards that believe who the most accurate pollster is can literally be determined on this basis alone, and that historical comparisons of poll accuracy can be made by this standard as well!
(I say “is problematic for” because “proves wrong” is too direct, I'm told)
If the field’s current practitioners would like to defend their position that undecided voters in every election, regardless of how many there were and the unique factors underpinning each election always split 50-50, they are more than welcome to - but they would lose that debate very quickly. Mathematically, logically, empirically, I'll let them pick.
The above is one of many uncontested but easily disprovable hypotheses accepted as fact in the field.
Given a Simultaneous Census of:
Candidate A: 45%
Candidate B: 45%
Undecided: 10%
Which poll was most accurate?
Ah, now we can do some math.
Use whatever method you want, if the population is 45-45-10, and the random samples produce 46-44-10, and 44-46-10, respectively, those polls were equally accurate. Both had a very small error, but were equally accurate.
See where I'm going?
Two polls, with small, equal errors, would be viewed, by current standards, as:
Poll 1: 0 error
Poll 2: 4-point error
Again, not disputable that current standards would say this. The only question is when the inaccuracy of this “solution” will be addressed by the field.
In fact, to take the consequences of this understanding one more small step:
Given a population where two candidates have equal support, producing a poll that states the eventual winner is “ahead” is literal, definitional chance.
46-44 and 44-46, from a population of 45-45, is equally likely.
Chance, not methodology or skill, plays a large role in these calculations.
And yet, the spread method which is shown to easily fail is claimed as the gold standard of crowning Who Is Most Accurate.
Given Simultaneous Census data, 45-45-10, we can calculate poll accuracy with 100% confidence, no election result needed.
(This fact serves as an informal but simple disproof that the election result is the ground truth or objective standard for measuring poll accuracy)
Lazily assuming, for now, that no voters changed their mind, a mere 60-40 split of 10% undecided, caused two equally accurate polls to be viewed as 0 error, and 4-point error, respectively.
There's a lot more work to be done, and it can certainly be done, but not until we move away from “spread” as the center of the electoral universe.
How To Calculate Error When Simultaneous Census Is Unknown
I'll leave you with this:
The only reason the election result is even remotely relevant to the calculation of poll accuracy, is because it can assist in working backwards to estimate the simultaneous census.
From the election result, we can work backwards, accounting for known confounders (changing attitudes and undecided ratio) to estimate the Simultaneous Census.
In my book I propose these Adjusted Methods, along with a formula, and you can use it as-is, or modify it, or invent your own for all I care. But if you want to do valid scientific work, you must not continue using the current “assume you know” standard.
If undecideds split 60-40 in favor of Candidate A, that's not negligible.
If a net of even just 1% defected from Candidate B to Candidate A, that's also not negligible.
And when you consider the compounding (or compensating) nature of these confounders, the calculation becomes more challenging than “pretending you know” - but much more internally valid.
In my research, I found that there is already some good data on these confounders!
FiveThirtyEight shared this chart showing that “late deciders” (that is, undecided in polls very close to the election) went overwhelmingly for Trump in 2016.

Well, I'll be damned.
Does that look like undecideds split evenly to you?
Their calculations assume they must have!
For one, there's a reason these analysts don't want to talk about Utah in 2016 (I do) but let's just think about this undecided problem for a second.
FiveThirtyEight (and the entirety of the field’s analysts) has good data to suggest undecideds didn't split evenly in 2016.
Does their analysis incorporate this?
No.
When it comes time to figure out who the best pollsters were, how much “error” the poll averages in 2016 had, and report to the public how much the polls “missed,” do they account for this known confounder?
They are handed, on a silver platter, this data that shows “hey, yo, whoa, undecideds didn't split evenly, not even close"
And then in their analysis, they don't just place assumptions where they could have data, they place assumptions where they DO have data.
Welp, polls were off by a bunch in 2016, they say. They cite those numbers to this day. As do, I would wager, you and every person in the field.
Then, without batting an eye, they turn around and say “but the national polls were pretty accurate because they got the spread pretty close.”
It's remarkable that otherwise smart people could be so…not.
A great visual, and inspiration for the cover of my book, illustrates how I believe poll accuracy calculations should be done.
Some great work out of the UK, the British Election Study.

Starting with the known electoral result, work backward to account for variable change.
Note what happened with undecided voters - not close to splitting evenly.
Note how many voters changed their minds - not close to zero, or net zero.
Non-US analysts use similarly flawed calculations for poll error, assuming no one changes their mind close to the election, and assuming they know how undecideds split. Even with this data that removes the need to assume.
The ability to do better work in this field is so, so close. There are many big questions that still need to be answered - and many bigger questions that we haven't even thought to ask yet.
The field has the technology, knowledge, and skill…but has to accept the spread-centric model of the polling universe is not the correct one.
“What the data mean is always far more important than what the data say. Rules of analysis are necessary, rules that are not as shortsighted as “8 points is comfortable” and “2 points is a close race.””
“Many polls remembered as wrong were, in fact, right.”
The Takeaway
If you're interested in knowing who the most accurate pollsters were, or how accurate “the polls” were, the first step, not optional or supplementary step, is to account for known confounders.
A two-point discrepancy between the spread method's calculated error and true error might not seem like much - but it is currently the difference between “historically accurate” and average accuracy, average accuracy and “worst polls in decades.”
And in some cases, the spread method has contributed much more error than that.
Currently, panels and intense scrutiny only happen if polls don't “estimate” the result properly. Compensating errors are allowed to contaminate data without concern - because the current methods are definitionally incapable of studying them.
A poll-driven expectation of what the result “should be” causes a lack of vigilance, and sloppy analysis. The public is misled, and statistical literacy suffers.
As Panagakis noted decades ago, many polls remembered as wrong were, in fact, right. He had an understanding of the unnamed simultaneous census standard and the impact of confounding variables on the traditional error measurements still used today. Based on his writing, he assumed his colleagues also understood this standard, and simply needed to convince them of the possibility of a lopsided undecided ratio and its consequences on their calculations, among other things. I believe that is where he erred.
His work gave me added context that even things that seem foundationally obvious - such as experts who say “yes, I know polls aren't predictions” - cannot be taken at face value when their analysis proves otherwise.
I hope, in the near future, my work is accepted or modified on its merits - because there is no valid scientific reason to reject the core findings. And also that Panagakis rises to his rightful place among the field's foremost innovators, for his contributions to the field decades ahead of their time.
Support My Work By Sharing It
If you would like to support my work, please forward this article to any individual or organization that you think should read it, and if you would like more depth on this topic, you should buy my book.
Media, Panel, Speaking Engagements
Given enough notice, I can make myself available, and in most educational circumstances I'm happy to do it for free.
There’s only one close to accurate poll, the election. Given that, how can polling be presented to candidates and voters in a meaningful manner? Personally, I watch the trends in polling numbers, because what you’re saying is right, but I’m trying to make decisions with polling as one of the strongest arrows we have…