


What 538 (and everyone else) missed
I think it's safe to call it

I haven't been shy of my criticisms of the folks at FiveThirtyEight. With great power comes great responsibility, or something like that. They have the biggest reach of any “forecaster” and while they deserve tons of credit for growing the field, they also deserve lots of blame for promoting bad data.

The “midterm trend” is one such piece of bad data. While it's true that the President’s Party generally performs poorly in midterms, to take that generic trend and apply that to a specific election is not valid.
Here's how I explain the difference:

The reason we sometimes use general trends to form our predictions is because general trends are the best we can do.
But what similarities do the 2022 midterms have to those of 1942? 1990? Not much.
More importantly, we know the variables. This isn't hindsight “ah, we shoulda been on it, we'll get em next time” kind of stuff.
I pointed it out after Jan 6th. I pointed it out after the Roe decision. Generic midterms run generic candidates with the goal of winning seats. Republicans made it clear their party was owned and run my Trumpism, they would run extremist, far-right, flawed candidates who have an unpopular platform. What does that mean?
The “midterm trend” doesn't matter.
Here's my comment after the Roe decision:

Now, 538 was not the worst of the bunch. Their forecasts were, mostly, data-driven (even if the data was bad, more on that in a minute). But RealClearPolitics was an absolute dumpster fire.
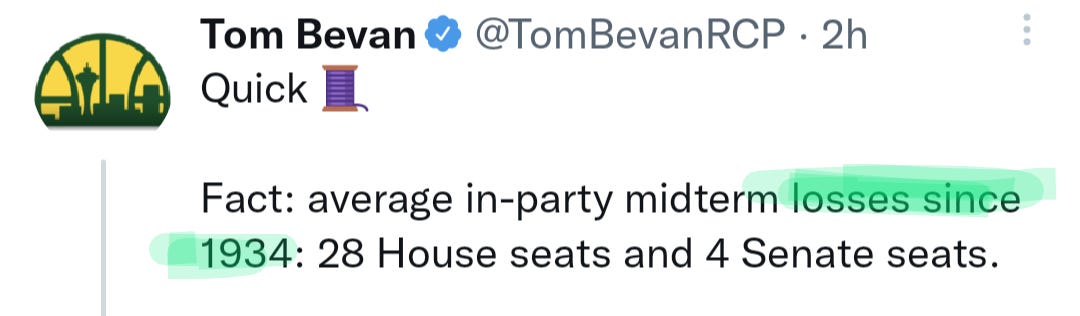

“We should have a very strong prior against it”
Why?!
While I don't know Tom and have very little consideration for his work - it doesn't seem very good - Sean did some outstanding (and I mean outstanding) work prior to the election.
He wrote what I consider the most analytically sound piece regarding the path to Dems maintaining the House.
That's not to say it was flawless. It relied a too much on approval ratings and historic trends…not relevant…but the meat of the analysis got really good.
He mentioned “supersized” Dem turnout because of Roe. He mentioned the polarization and impact of Jan 6th. He broke down which House seats might be in play and why.
A little too reliant on generic ballots and not enough on specific races with weaker candidates…but not bad!
And then…unfortunately…just kind of ignored all of that great work, handwaved it away in favor of, basically, “but midterms. Biden unpopular.”

So close.
Now, as to the Senate where I did the bulk of my analysis, the two camps were:
538, Economist, Everyone Else (overly reliant on recency bias, partisan polls)
RealClearPolitics, “but midterms”
The good people at FiveThirtyEight had Rs as 59% to take the Senate with a greater than 25% chance for Rs to hold 53+ seats. Those tails are way too wide (a flaw in their methodology I've touched on before) but even the raw win probability was off by my forecast.

The folks at The Economist had Rs at 57%.
I can't find their tails but based on the 95% outcome range (and the fact that their forecasts tend to track nearly identically to 538’s) I'm guessing they were in the same ballpark.

I feel bad even mentioning RealClearNews and whatever the fuck kind of forecast this is but whatever.
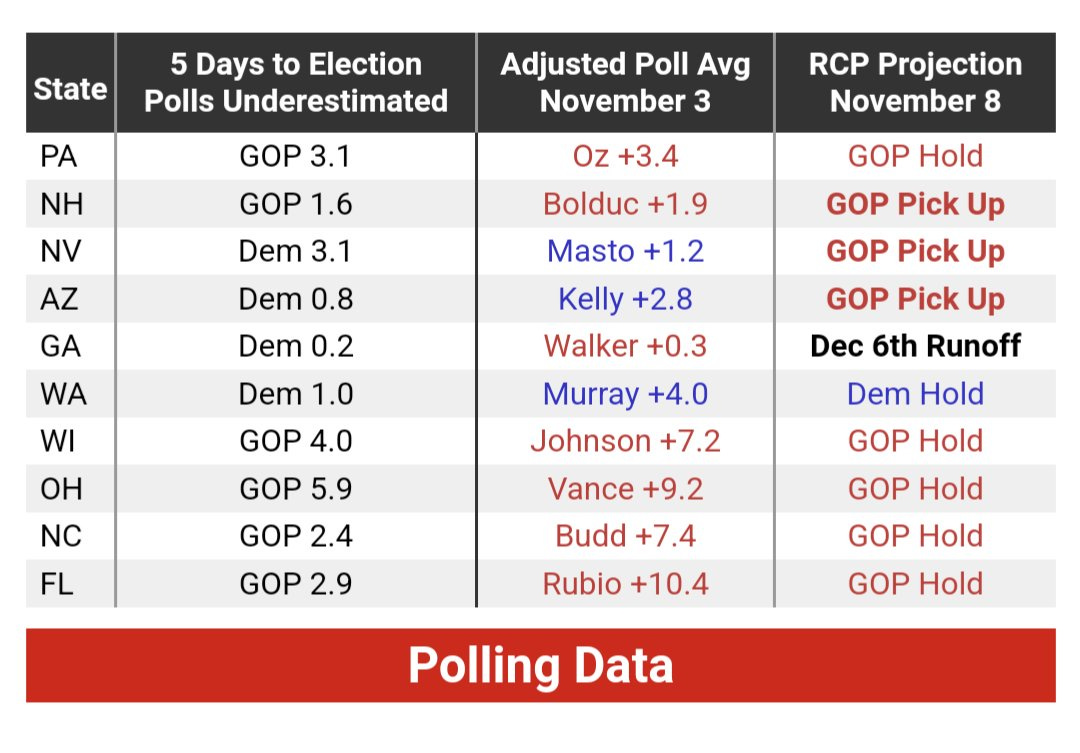
The late noise in polls dramatically threw FiveThirtyEight and RCP forecasts.
Let me say something you'll have to take my word for if you're not a data person: when a state like PA is seemingly close in the polls/win probability (and would be a flipped seat for Rs) just small movements in win percentage can have a huge impact on your overall forecast.
So, when they messed up PA (Dems should have been medium favorites, not medium underdogs) their whole forecast was skewed.

Now, PA wasn't the only place they messed up in the same way. New Hampshire, Arizona, missing these places caused them to overestimate the likelihood Rs picked up lots of seats.
Check out the trend over time of our forecasts
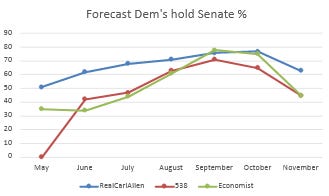
Starting in May/June, you can see a pretty big discrepancy in forecasts. I was to their left in AZ, PA, GA, and NC
It was early. I was bullish on Dems chances Roe, added to the fact Rs were running shitty candidates, but they seemed to still be weighing "but miDterms pRiOrS" pretty heavily.
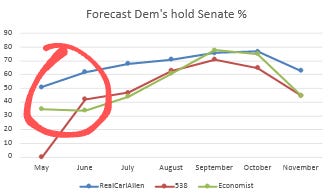
And then!
Something happened here.
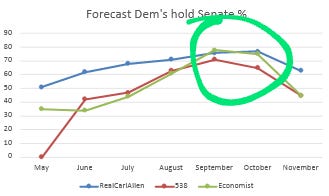
The Economist (who closed at Ds 43%) moved TO MY LEFT in their forecast.
So...not “but midterms priors” anymore? Cool, I thought. Took them awhile to catch up, but their forecasts converged on mine.
Minor win. Victory lap. Obnoxious Twitter posts.
FiveThirtyEight moved to my left in PA (!!!) which I said was overreacting to noisy polls that had Oz unsustainably low (low 40s) but I figured it just took them awhile to see what I had been seeing.
And then, something happened in Mid-October, then late-October, then right before the elections that sent these dudes into an anxiety attack.
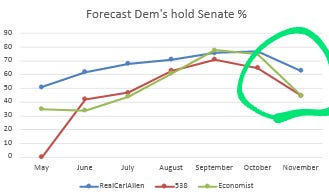
At FiveThirtyEight they had Dems as medium favorites 3 weeks before the election, coinflip favorites the week before the election, and smedium underdogs the day before.

At TheEconomist, 3 weeks in advance of the election, they had Dems as comfortable (but not runaway) favorites
1 week before they had Dems as coinflip favorites...day before smedium underdogs

So what happened?
They both just threw out (perfectly fine) poll data that was 2 weeks old, in favor of data that was 1 week old.
That shiny, newer data just happened to overestimate Rs
Problem?
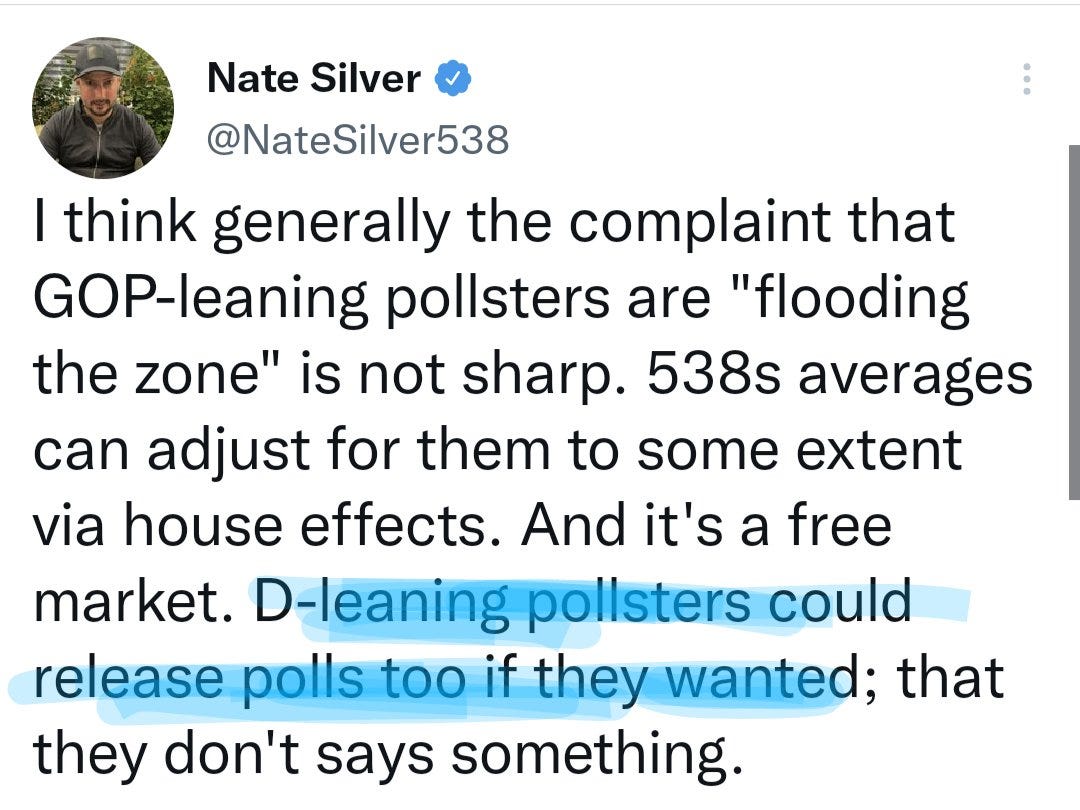
Nah. See, Nate says since D-leaning pollsters didn't release many polls, that's a signal.
So two things happened:
1) They treated partisan poll data as independent (e.g. not weighting them all as one partisan entity, my preferred method, but as independent ones)
2) Extreme susceptibility to recency bias
Why is 5 day old poll fundamentally more reliable than 10 day old data?
Nonsense.
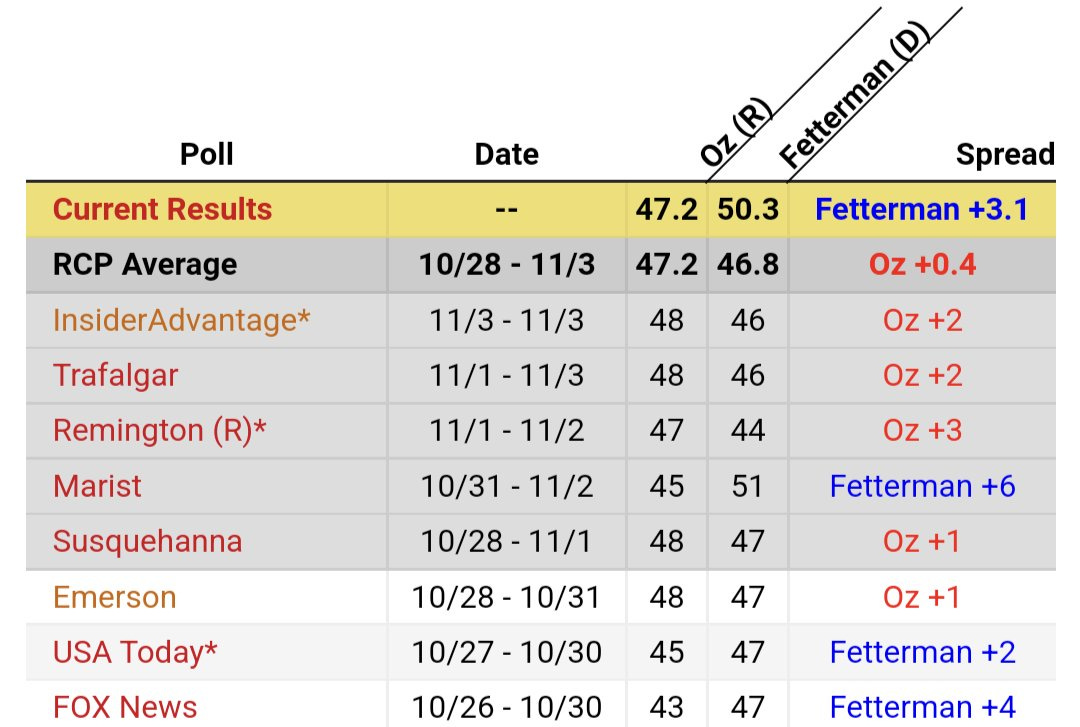
But Carl, you might be asking, what about that debate in PA? It was bad. It might have actually moved things.
True!
What did the data say?
Fetterman's poll average in the upper 40s before
And (even if you don't weigh down partisan polls) a few points lighter.
But did those late (mostly partisan!) polls have those Fetterman voters flipping to Oz?
No!
Oz couldn't break 48 to save his fuckin life.
Does Mr. Carl need to remind you all of the importance of POLL NUMBER vs POLL MARGIN?
Apparently the "experts" need that lesson.
So what did I see that they didn't in these late polls that sent them spiraling into a panic attack?
1) Partisan polls (while I do not throw them out) do not receive equal weight, and I don't treat them as independent, nor should you.
2) The governor race was a consensus fuckin blowout.

If you were a betting person, and you had to predict where those formerly-Fetterman now (allegedly) undecided voters would end up (which is, by the way, the primary challenge of a forecast) where would you lean?
FiveThirtyEight and Economist said Oz.
For me, it was EASY. They were wrong. They read the polls wrong, gave too much weight to recent and bad polls.
Now, RealClearNews has taken a lot of shit for their simplistic poll averages.
Here are the final PA poll averages for RCP and FiveThirtyEight. RCP is extremely transparent about where their poll averages - a very simple recent average with no weights - are coming from.
Compare to 538.

Oz 47.2-46.8
Oz 47.4-46.9
For all the bluster NateSilver mentioned re adjustments and signal vs noise his avg is indistinguishable from a simple recent average.
Ok, but PA, maybe just the debate thing.
Nope. Look at NH.
48.7-47.3 simple avg
48.8-46.6 super fancy weighted advanced genius average.

And this isn't hindsight by the way. A lot of hacks & casuals like hindsight "what you missed 🧐"
That's not me.
Here's me pointing out that it's happening, and why it's wrongly influencing their forecasts, a week before the election:

The company that has made a name for itself for being the best at forecasting is producing forecasts and poll averages that are indistinguishable from a simple recent average and are consistently missing in predictable ways.
At least in RCP’s poll averages their methodology is transparent and consistent.
So closing thought 1 for aspiring forecasters, + smart & talented people already making forecasts
𝗜𝗳 𝗮 𝗳𝗲𝘄 (late, partisan) 𝗽𝗼𝗹𝗹𝘀 𝗺𝗼𝘃𝗲 𝘆𝗼𝘂𝗿 𝗳𝗼𝗿𝗲𝗰𝗮𝘀𝘁 𝘁𝗵𝗶𝘀 𝗺𝘂𝗰𝗵, 𝘆𝗼𝘂 𝗱𝗼𝗻'𝘁 𝗵𝗮𝘃𝗲 𝗮 𝗳𝗼𝗿𝗲𝗰𝗮𝘀𝘁.
You have a nowcast with error bars.

Why even bother making a forecast if it's going to go from 75% to 43% (or 66% to 41%) in two weeks?
Wait until the week of the election if you're only going to remotely consider with 100% weight the polls that come out (regardless of quality) that same week. Jesus.
Closing thought 2: the work I do is not genius level advanced shit. It does require some critical thought, maybe getting over some preconceived biases that have been taught to you as “convention” (see: poll margins and midterm trends) but ultimately is nothing more than a logically and statistically valid way to read polls, and make forecasts.
If you would like to be a part of my poll data series, that teaches you to be the forecaster, and is for anyone (expert or newbie) who wants to be a part of a fun, interactive project subscribe. It's starting in less than two weeks.