UK polling aftermath
Is this really the best we can do?
This is a not-that-technical post about why measuring whose polls were "most accurate" based on:
A) One poll
B) By how well it predicted the result
Are garbage
Anyone who performs this analysis should be ashamed.
To be clear, I don't know Andy, but based on his posts I have to say I have a high regard for his work.
When I criticize someone's work or analysis, it's not because I think all of their work is poor - I have learned more from other people than I could ever teach.
And Andy is not alone in this analysis. Most every (if not literally every) expert does this.
This “polls as forecasts” analysis needs to be fixed.
1) Building a forecast from one poll is junk science. Polls are, even in IDEAL circumstances, subject to error (it's called, as most everyone knows, the margin of error).
While the margin of error can feel abstract, I am obligated to remind you that it is not.
Below is a sample of results in which KNOWN population proportion is 50%.
But even an IDEAL poll would almost never return that result.
In the real world, we know political polls aren't “ideal.”
But other polls can be. The basis upon which poll math is derived (margin of error and confidence level) was explained using marbles and an urn.
That is, an unchanging population whose true proportion could be known.
Which is to say, even if we grant the most generous favorability to the quality/accuracy of polls, it CAN'T be (objectively, provably, mathematically, whatever term you prefer) any more accurate than this ideal.
This is important to understand.
2) Requires short lesson on UK poll methodology
They allocate undecideds, basically, proportionally to decided voters.
This is nothing more than another junk assumption.
There's no reason undecideds wouldn't/couldn't ever favor a party with fewer “decided” voters. (Indeed, that's what my forecast incorporated as most likely, because that's what the data best supported)
Here are the results from Survation's poll. You have to download the report and dig for it - they never report them.
Short version:
Labour: 36.1%
Conservative: 19.5%
Undecided: 18.8%
This is not reported.
Step 2, cont) Throw out undecided
100 - 18.8 = 81.2
New calc:
Lab 36.1/81.2 = 44.5%
Con: 19.5/81.2 = 24.0%
Many pollsters use this as their reported result.
Survation goes one (small) step further and they "weight" likelihood to vote, and ended up at these results, erroneously reported as their "poll" (which is actually a forecast) per tradition.
Labour: 45%
Conservative: 26%
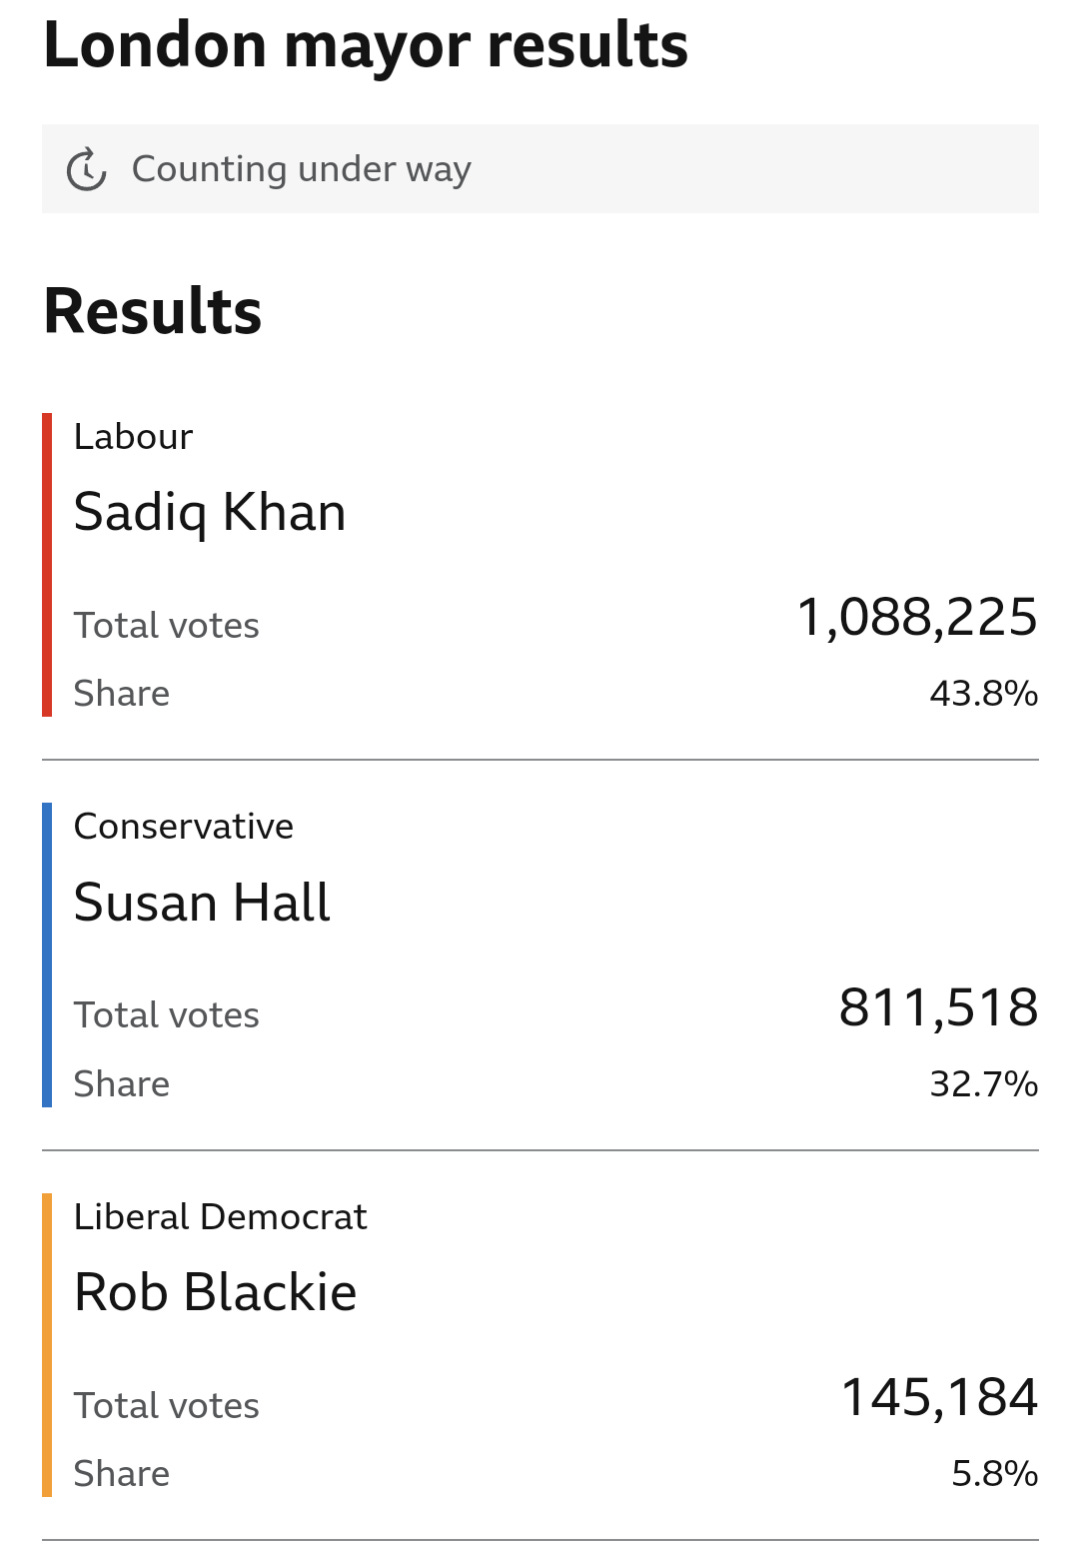
Here was the result:
3) This forecast, which overestimated Labour by one and underestimated Conservatives by SEVEN) is...considered the best poll (by virtue of having, I guess, the best forecast?)
I must say again:
More to the point
Why was my forecast (median Lab 44.5, Con 31.7) so much more accurate?
If everyone was looking at the same data, why was my (median) forecast so much closer to the result?
There are many answers, but the first one is that I wasn't arbitrarily limited to looking at one piece of data to inform my forecast.
I understand, like you probably do (and certainly do if you read things I write)
4) Polls offer noisy data that should be, on average, pretty accurate.
But accurate compared to what?
Here's the simplest way I can explain it:
1) The Margin of Error given by a poll ALSO APPLIES TO UNDECIDEDS
2) How those undecideds eventually decide is IRRELEVANT to a poll's accuracy
Re: point 2
If a POLL observes Lab 39, Con 20, undecided 18
What does that data MEAN?
It means if a simultaneous census were taken to that poll (same population, same question, same time)
Then
Results should be within MOE given confidence level.
Periodt. End of poll analysis.
5) Even if we grant most extreme assumption: the only source of error in this poll is the Margin of error (ideal poll)
It's still subject to a lot of fluctuation
The same poll, with same methods, could easily observe:
Lab: 39
Con: 20
Idk: 18
Or
Lab: 41
Con: 18
Idk: 18
Or
Lab: 37
Con: 22
Idk: 19
The above “fluctuation” is nothing more than an indisputable fact of statistics no one could argue with.
6) We can apply the same "likely voter" weights to the poll, given these roughly equally likely poll results, to see what they would have said (if they attempted to forecast from it)
Poll 1 (actual):
Lab 45
Con 26
Poll 2 (small Lab bias)
Lab 51
Con 24
Poll 3 (small Con bias)
Lab 46
Con 29
7) Forming a forecast from one poll violates what should be the most obvious rule of poll analysis (and why I say they should be ashamed):
Fluctuation is normal and expected.
More to the point:
8) Analyzing whose polls were "most accurate" based on which forecast from one poll was "most accurate" is searching for meaning where there is none.
Poll 1’s forecast, despite being very inaccurate, was rated as the most accurate.
Noise and luck, not methodology, not even performance, determines whose poll is perceived as "most accurate" in this analysis.
Furthermore,
9) Terrible forecasters were rated as "right in the middle."
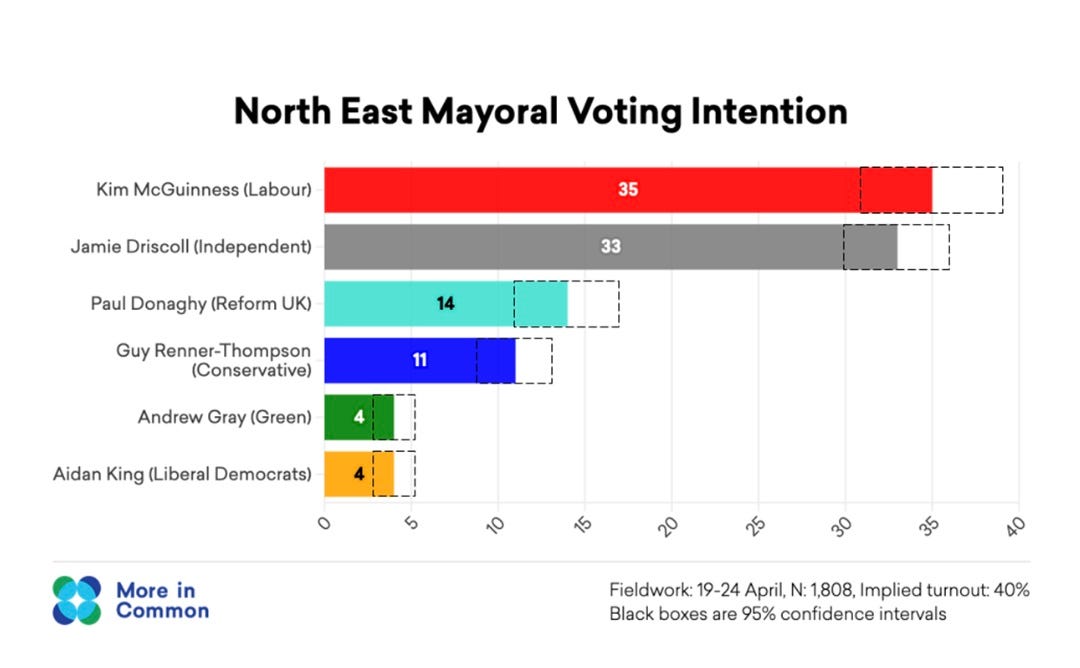
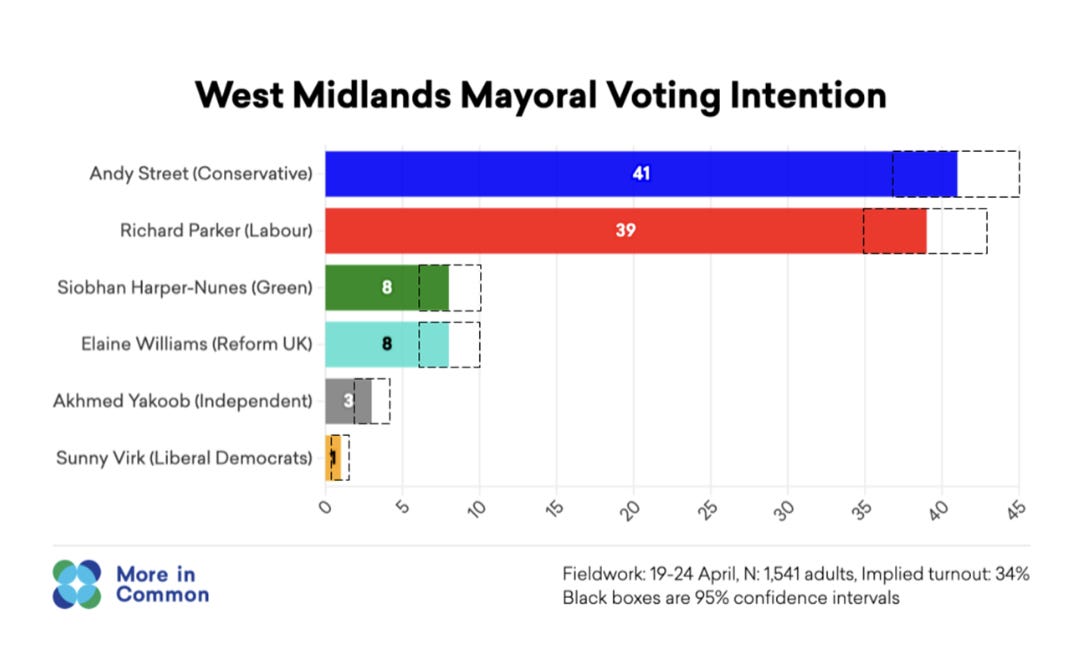
This pollster assigned a 95% CI when results fell outside of it…100% of the time.
McGuinness finished at 41%.
Graves finished under 11%
Adlington-Stringer finished over 11%.
Now, results should fall outside the MOE a SMALL % of the time. But this analysis (which doesn't know the difference between polls and forecasts) will do it a lot more often.
When your math consistently disagrees with reality, your math is wrong.
9 cont) I hadn't even looked at them until I wrote this post, because I'd pretty well discarded them as reputable forecasts, and I knew basically what I'd see if I looked - but, due diligence…even worse than I expected.
They're outside their stated margin of error on EVERY ELECTION THEY POLLED (and forecasted)
Spencer finished at 6.9%.
West Midlands was, by far, the worst.
Yakoob, the Independent finished at 11.7%
They had his upper range at FOUR PERCENT.
In a healthy field, this is a red alert. Assigning 95% confidence intervals where you're outside of it in every single forecast is not, contrary to other analysis, “right in the middle.”
It's a catastrophic failure indicative of some enormous flaws.
I identified those flaws at least 5 years ago, and have been collecting and reporting on how those flaws presented themselves in the past- and, given the value of good science, predicting when, where, and how - those flaws would present themselves. I've been right every time, even righter than I realized in many cases, and it's not getting better.
Chasing better forecasts (which they erroneously call polls) UK pollsters are adopting more and more pseudoscientific methodology, misinforming the public and denigrating the field in the process.
10) It only sounds like I'm being an ahole, it's because I am one.
But I'm not wrong.
Much more important point though:
Polling is MUCH HARDER THAN FORECASTING.
Most people, after reading what I write (if they don't dismiss it because I'm too mean) would conclude that these pollsters are not to be trusted.
But that's not true!
These pollsters collected really good data. All of them. Even the ones I shat on!
Here's a really important mathematical formula:
GOOD POLL + BAD FORECAST DOES NOT = BAD POLL.
Sometimes, people remind me I'm not crazy:
What I'm saying is, their polls were good, and their forecasts were bad - because they don't understand the difference - and tried to apply the margin of error given by the poll to their forecast!
This is wrongly interpreted or simplified as “polls were bad.”
The current state of poll data (especially non-US)
Conflates polls with forecasts.
It is a dangerously unscientific process that undermines trustworthiness & advancement of the field.
A poll observing:
Lab 39
Con 20
Idk 18
Can ONLY be judged for accuracy (in a truly scientific field) by how close that population is to:
Lab 39
Con 20
Idk 18
AT THAT TIME.
Polling is - forgive the pun - a labor intensive job. It is very hard. As I demonstrated, polling is an inexact science - but it IS a science.
Forecasting, on the other hand, is a much more subjective process. It incorporates lots of other data besides polls, and yes, assumptions. More assumptions than any forecaster would care to admit, and probably more than any realize.
My forecasts, since I started in ~2020, have been very good. One day, they won't be. Forecasting is not the thing I'm best at, and I hope that people smarter than me will incorporate some of the concepts and understanding that I (and others) have that allows my inferior math to produce superior forecasts.
But I will never BS you as to WHY my forecasts are right, wrong, or otherwise (as other forecasters do).
Forecasting requires PREDICTION about, at minimum, how that (large number) of "idks" will decide.
The accuracy of a poll CANNOT (in a proper scientific field) be judged based on how accurate it FORECASTS how they will eventually decide.
And even this ignores strong possibility of compensating errors (a topic I'll cover another time).
So, to conclude:
11) Pollsters should report their data as they observe it - including, and NOT allocating or “excluding” undecideds.
If they want to continue forecasting, that's fine, but don't lie to the public and report your FORECAST as if it were your POLL.
It leads to the misconception that polls and forecasts are the same thing.
Fwiw, a poll average (which required downloading lots of reports, because they don't report their actual numbers) of
Allowed me to forecast below:
The relative lack of polls + high idk is what led to the uncertainty. My range of outcomes were much lower in my US Senate forecasts, for example.
While I was very close (median spread forecast 12.8, actual spread 11.1) I'm going to remind you: even if the “actual” were 6 or 16, my forecast was still good.
It could've been 6 or 16 and I'd have felt just as good about my forecast.
I'm not going to be a hypocrite like other forecasters and take a victory lap when I'm “right” and then berate the public with “it'S juSt ProBabiliTY” when my median is more “off.”
It's just probability when my median is very close, too.
So, re: my wide range - Yeah, it was pretty wide. But my 95% confidence should fall within them about 95% of the time! Not too much more, and not too much less.
Good forecasts should. I mentioned earlier, that there was good data to suggest undecideds would lean conservative (not, as other forecasts asserted, proportional to decided) and also:
Reform polled from 4 to 6 in the London Mayoral Polls, and finished at 3.
There's not good data to support it yet (probably won't ever be, due to the industry's misunderstanding of what poll error is) but I think the best hypothesis based on the result is that undecideds - as I predicted - favored Conservatives, and a small but not insignificant number of people who polled “Reform” strategically voted “Conservative.”
My track record of forecasting is very good.
It may or may not be in the future
But the quality of my forecasts is irrelevant to the quality of my analysis.
What polls mean, how they should be reported and analyzed for accuracy, will stand on their merits.
I hope that analysis makes sense, resonates, and allows you to be more informed in how you look at (and interpret) poll data.


