

The formula that underlies poll data - and the larger field of inferential statistics - is a remarkably simple one for how powerful it is.
A random sample taken from a population can tell you almost anything about that population within a margin of error (MOE).
A Very Brief History
In political applications, this scientific tool was famously first applied to US Elections in 1936 by George Gallup.
But “polls” and “surveys” are just the name we give to this statistical tool of “random sample” in some specific applications. The math can be applied to populations of marbles, or mints, or people: it makes no difference to the math.

I actually did this experiment with thousands of mints, if you want to read about it in my book, or on my Substack. But for now…
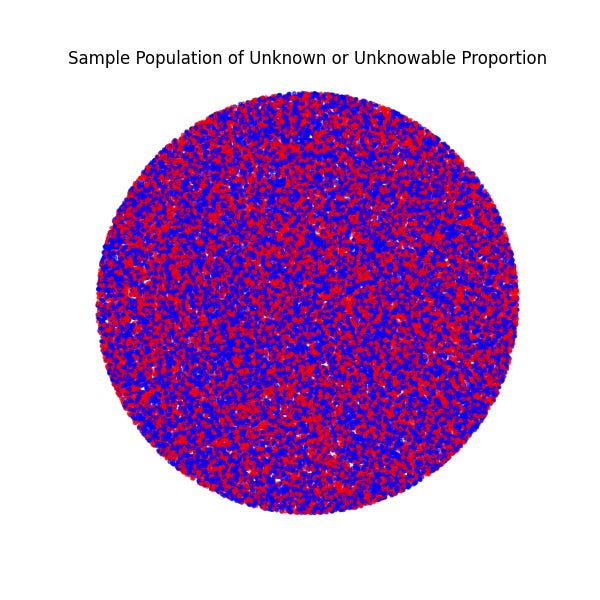
This Is A Population
Have a look.

This population is represented as red and blue dots. You can pretend they're registered voters in a city, men/women in a town, marbles in a bin…or just dots.
It doesn't matter.
With the magic of computers, we could probably count all of those dots, if we wanted.
If I gave you enough incentive, and there were a reward for being right, you might even do it.
And how about now?
One, or two?
The first one is countable if you really want to know (and have the time, patience, ability).
But the second one? Not so.
And for perspective, that first population had 5,000 dots, and the second had 50,000.
In political applications, we're usually dealing with populations much larger than that.
So we take a random sample. Not because we're lazy, but because it's impossible to count everyone/everything.
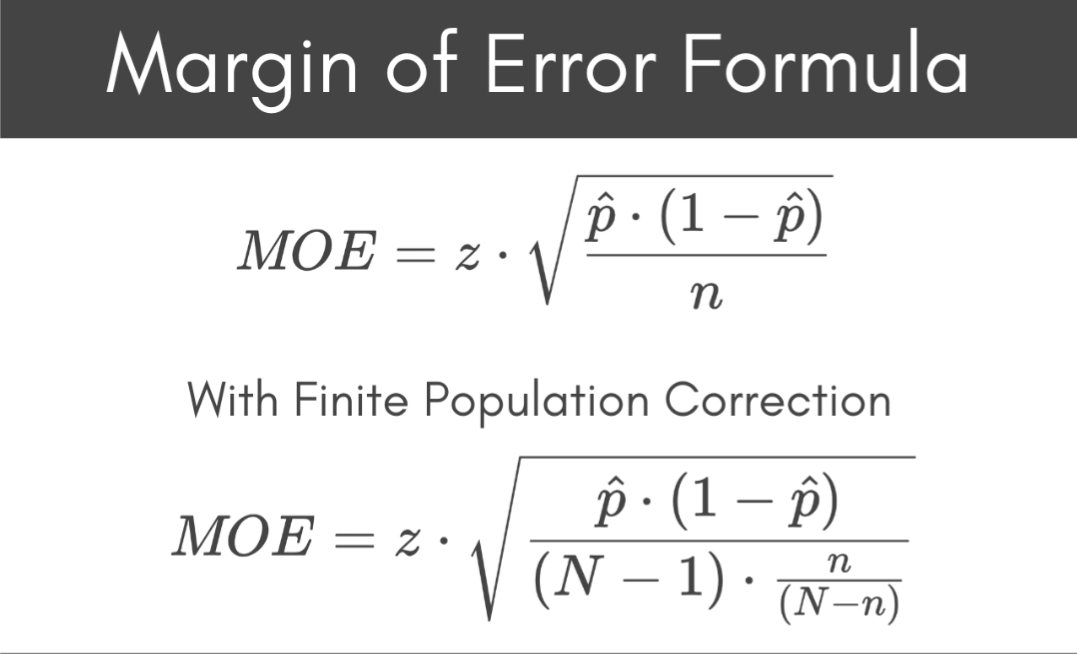
The size of that random sample can be plugged into that MOE formula.
Margin of Error Explained (and your mind blown) in Four Charts
The formula for the margin of error, given a random sample from a population, is not debated or debatable. Also important to note for later, it’s not theoretical or hypothetical either - it's a fact.
But not all facts are intuitive.
Like I said, I won't be diving into the numbers here. Leave a comment if you want more explanation, but here is chart one:

If you have a population of 100, you need a random sample of 86 to have a margin of error of +/- 4%.
That means, if you ask 86 random people from that population of 100, and 50% say “yes” and 50% say “no”
Then, almost certainly:
46% to 54% (50% +/- 4%) of the whole population would respond that way.
Yes, I've done “surveys” of this size with college classes, to illustrate some poorly-understood concepts that I'll show you shortly.
But we can agree, this data is not practically useful yet - that's a wide range of uncertainty to accept when we would only need to ask 14 more people to know the precise answer.
But the math “is what it is,” and as we scale it up, I've found that this example is extremely useful to have as a reference point.
Now for a slightly larger population:

2500, not uncountable, but we can get the same +/- 4% margin of error as above with a sample of just 486.
That means, if you ask 486 random people, from that population of 2500, and 50% say “yes” and 50% say “no”
Then, almost certainly:
46% to 54% of the whole population would respond that way.
Note I copy-pasted the “sample of 86 to population of 100” verbage for this larger population. That's intentional.
A random sample is more useful and practical, in this instance.
But now is where things start to become unintuitive…and illustrate the power of this tool that utilizes random sampling.
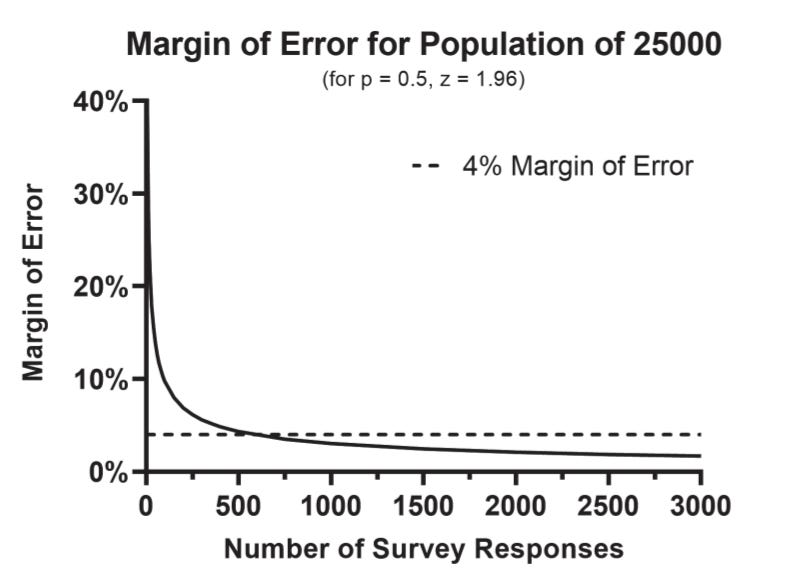
The population we want to know something about has grown by 10x, from 2,500 to 25,000. We're no longer dealing with a countable population; if we want to know (or estimate) something about them, we'll need a random sample.
A random sample of just 588 will get us to that same +/- 4% margin of error.
Copypasta time:
That means, if you ask 588 random people, from that population of 25,000, and 50% say “yes” and 50% say “no”
Then, almost certainly:
46% to 54% of the whole population would respond that way.
Now for the Mind Blower:

Yeah.
This means, if you ask 600 random people, from that population of 1,000,000,000, and 50% say “yes” and 50% say “no”
Then, almost certainly:
46% to 54% of the whole population would respond that way.
It’s not magic, it’s math, but you would be justified saying something like “a random sample of 600 is a magic number to obtain a low margin of error for a population of literally any size.”
I find the unintuitive nature of this formula interesting - it's a fun discussion. But it's not important for this article.
What's important is that you understand that it's true.
So far, there's no “expert” debunking - just an important baseline of understanding of this tool, how it works, and why it is useful.
The problem experts have with poll data starts with…
Nonbinary Populations
No, this isn't about sex or gender.
A “binary” is something that consists of “exactly two parts.”
Red or blue? Yes or no? Success or failure? Heads or tails? 0 or 1?
In short, all responses or observations can be represented by two (and only two) options.
In the dot population from before, “red or blue” were the only two options. Binary.
So, can we use random sampling for questions with 3 options? 10? More?
Absolutely!
Real elections sometimes have four or five options polling highly; no problem.
But we have to be careful how we interpret what that data means.
Even experts in the US mangle how much “error” there is in elections due to this misunderstanding (and you'll understand why by the end of this article).
So let's add a third option:

I've added some “green” to the red and blue.
So we're on the same page for this important step, let's pretend these 5,000 dots are the responses of all 5,000 students enrolled in a university stats class to the question:
Of these choices, which is your favorite color?
A. Red
B. Blue
C. Green
Wanna count the dots?
Me either.
I'll poke my machine to take a random sample from this population.

No, this isn't a color-blind test - this is an illustration of the same red-blue-green population, with 537 dots randomly selected.
A sample of 537 was selected to acquire the same +/- 4% margin of error as before.
This random sample with a 100% response rate, whose only source of error is the margin of error itself, is what I've termed an ideal poll.
Now, the only math we need to do:
Red: 239/537 (44.5%)
Blue: 245/537 (45.6%)
Green: 53/537 (9.9%)
This poll, like every poll, says that the true population from which the sample was taken is probably close to these percentages for each of these options.
The Takeaway:
If you take a random sample from a population, we can be almost certain that the percentage given is within the margin of error compared to the whole population.
Would you call me a Liar McBadPollster if it happened that the true Red-Blue-Green proportion (all the dots) were
Red 47%
Blue 44%
Green 9% ?
What if it was
Red 44%
Blue 48%
Green 8% ?
Those are very different - yet so easily within the margin of error I bet you didn't even feel anything about it. No more than 2.5% off for either major option.
But when who runs the freakin’ country is determined by it…we're less forgiving. Whether or not that's reasonable - a separate discussion.
But as for how poll accuracy is currently judged…compared to how it should be…it's just scratching the surface.
Whose Error, Anyway?
In the example above, I illustrated a huge (but knowable) population of Red-Blue-Green color preferences, and took a random sample from it.
Red: 239/537 (44.5%)
Blue: 245/537 (45.6%)
Green: 53/537 (9.9%)
The “error” of the poll is properly measured by comparing these percentages (observed) to the “true” percentage - which is the population we took the random sample from.
In chart form:

Simple enough, right?
Well…
Unknowable Populations
Most of the time, polls are taken from an unknown/unknowable population.
But that doesn't change what they try to tell us!
So what's the error of this poll, in this instance?
We don't know.
We can't know.
We know the percentages from the poll are probably close to the percentages from the population, but that's it.
“We don't know, and we can't know” is a very unsatisfying answer in science. But it's the only honest one in this instance.
So what do we know?
We know that the unknown/unknowable population from which the poll was taken is what we must compare to in order to find error - we just can't. It's a known unknown. Want to know, can’t.
Philosophers and logicians call this a epistemological limit. My mom would've described this problem as “want in one hand, shit in the other, see which fills up first.”
Either way, we know what information we need to solve the problem, but also that knowing with certainty is unattainable.
And this is where the experts get it wrong.
They think they can know and do know. They have “want” in their hand and think it’s worth shit - and it’s not. In other words, they think the election result is the appropriate true value for polls to be compared. Literally.

The above is from a slideshow hosted by Pew Research and the American Association for Public Opinion Research, in an effort to educate the media on poll data. “The blind leading the blind.”
The experts said that these polls were accurate because the “spread” between the top two candidates was close to the election result. This is how they teach it, because this is how they understand it.
And it violates the most basic rule of inferential statistics.
The post-election population is not the population from which the poll was taken. The post-election population doesn't even get asked the same question! Before an election, you can be undecided, after an election you can't be. If your poll has 5% or 10% or 50% undecided, that means your (pre-election) population is probably close to that.
How did those undecideds decide? The poll doesn't tell you, nor does it try to.
This means comparing the poll numbers to the election numbers is an invalid inference. It's bad science that we are supposedly taught to avoid in high school. Yet, that's exactly what they do, and what they believe.
Not a single election passes without experts comparing poll data to election data and based on that alone, concluding how accurate the polls were - and misinforming the public.
The underlying fallacies involved are a mix of status quo bias, hasty generalization, category error, dicto simpliciter, and plainly not understanding how inferential statistics work. Different analysts (depending on their background and expertise) lean on different fallacious reasoning, some employ all of them; this is a problem I must solve on a case-by-case basis in order to teach each individual why it’s wrong. But as far as facts are concerned, they all reach the same, invalid, polls-as-predictions conclusion.
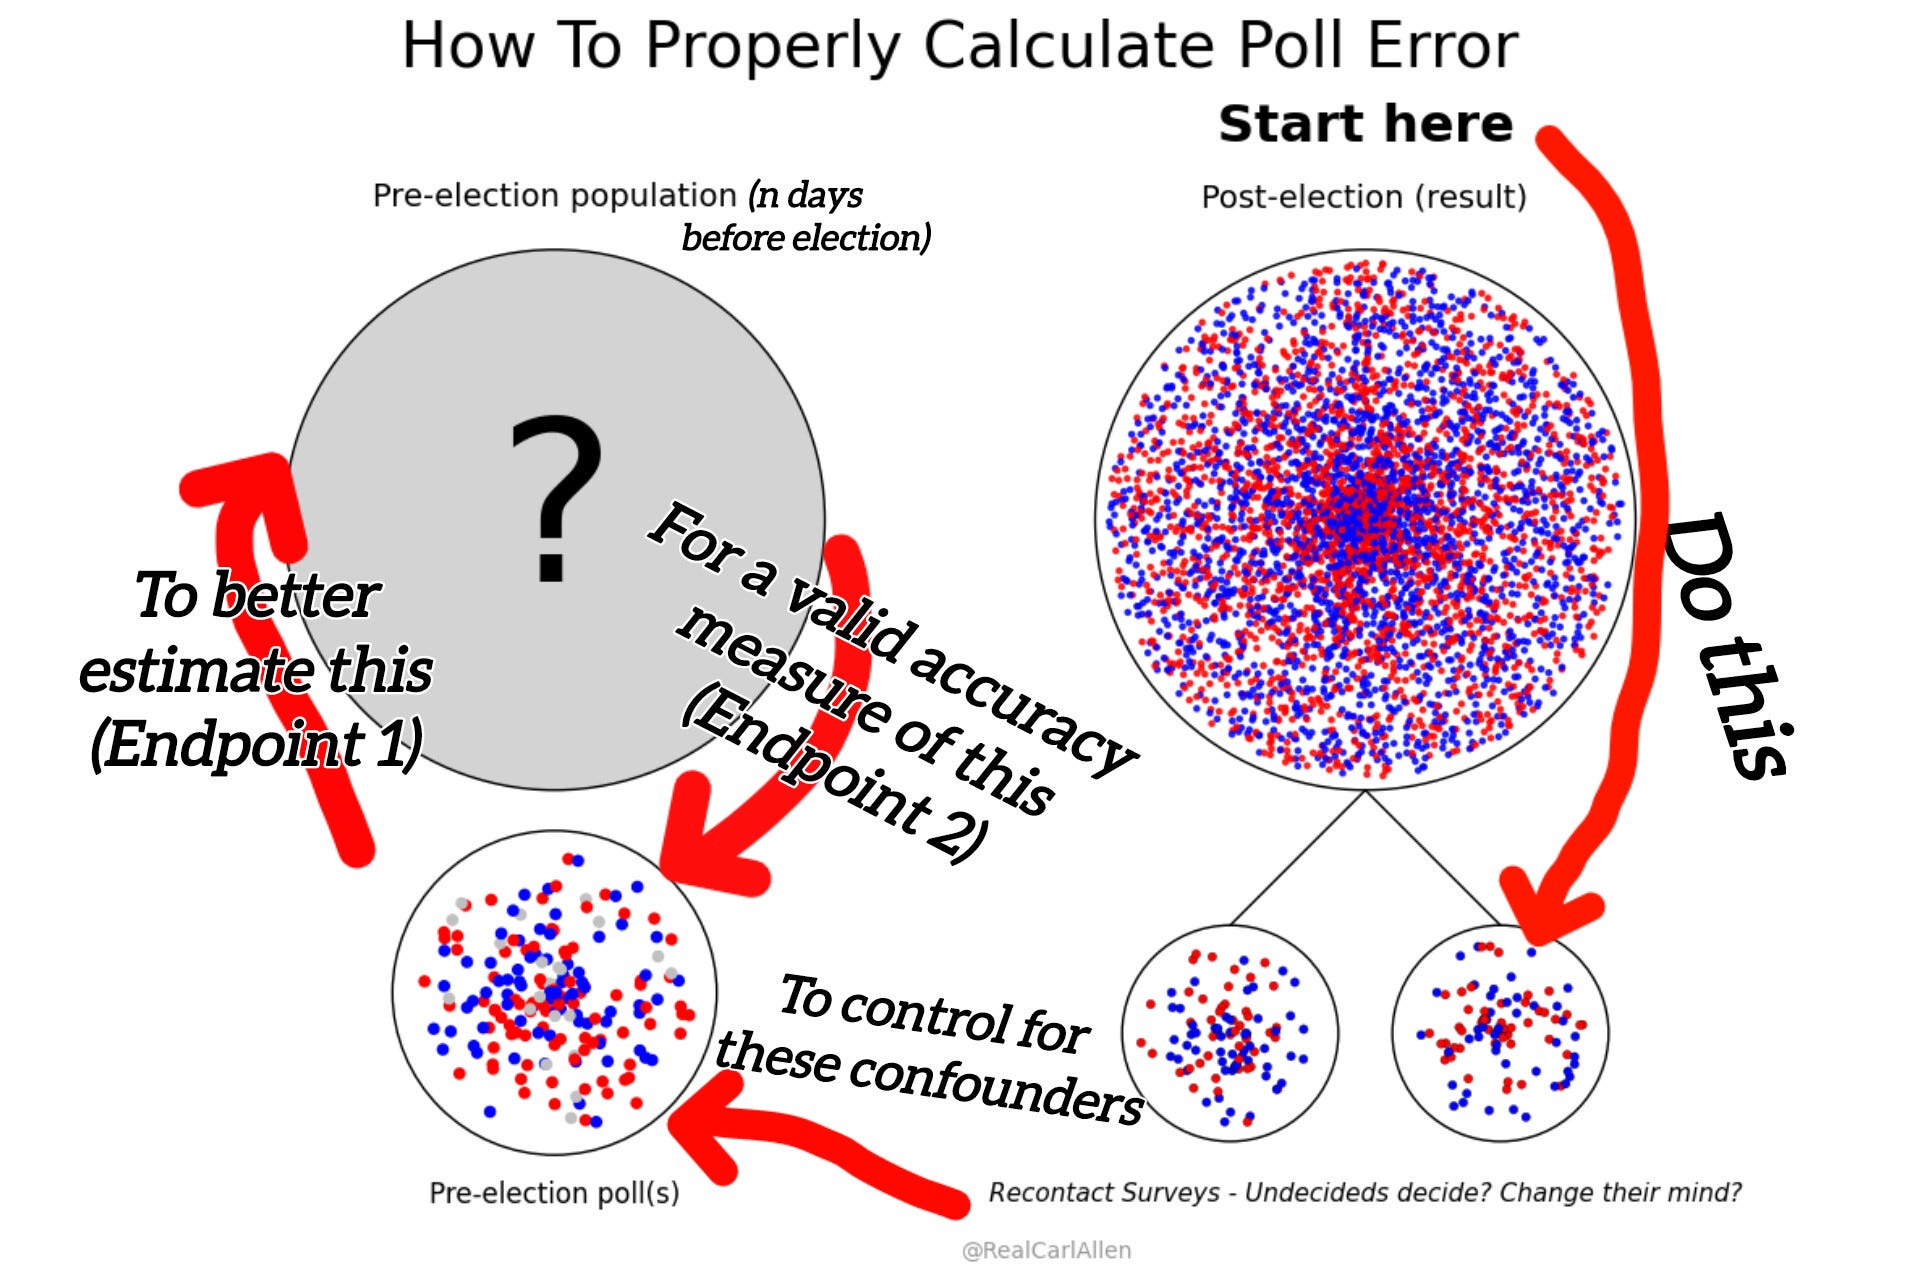
This simple chart explains the entirety of the problem. It is irrefutably correct, and the field's current consensus violates it.

Let “red” represent stated support for “Republican,” let “blue” represent the same for “Democrat” and “silver” represent “Undecided.”
Note that the pre-election poll(s) have all three options (and often more) - and that post-election support (measured by votes) do not have “undecided” as an option.
The question is: to which groups can we make an inference?
My research has led me to creating charts like this and showing them to people who may seem much smarter and more qualified than me, on paper. It's “arrogant” of me (they say) to even suggest that they don't understand it, despite their pesky “words” and “calculations” proving it.
In absolutely honest and not oversimplified terms, here is how polls are currently analyzed:
Analyst: “Based on these election results, if the polls were accurate, this is what they would have said.”
OR
Analyst: “Based on these polls, if the polls are accurate, the election results should be this.”
This is what the entire field believes around the world, as of now. It’s a consensus.
And they're wrong. All of them. On the basis of fact, that's not debatable. But “debate” is how flawed science is corrected, I plan to fix it, and I welcome your support.
Whether it’s the link between smoking and lung cancer, the motion of the planets around the sun, or the solution to the Monty Hall problem, every statistical and scientific advance passes through a stage where the evidence is clear, but the establishment resists. The minority (or a lone individual) can prove they're right, but the majority isn’t ready to let go of the framework they’ve grown comfortable with.
That’s where we are now - not with tobacco or the Monty Hall problem or astronomy, but with how we understand and evaluate statistical inference in political polls. The problem isn’t that better standards don’t exist, it’s that too many people - including experts - are unaware they exist, or are openly defending the statistical equivalent of epicycles.
The polls-as-predictions claim is, by any definition (logical, statistical, empirical) not valid. It's not valid because it's not an inference; it's hindsight bias masquerading as analysis.
The experts claim to understand how polls work, what a valid inference is, and some even concede that my chart could be nice for “introductory” classes. And then they proceed to prove they don't even understand it themselves! Amazing.
You (and they) can huff and puff with whatever close-ish, approximate, “good enough-ing” you want (it's a popular deflection), the point here is that it’s not a valid scientific procedure. It has no place in any respectable statistical analysis. At least, not if you know what you're talking about.
And honestly, it's probably far less “close-ish” than you think (it's far less “close-ish” than I thought it would be when I started my research) but it doesn't matter. When the field's scientists assert that an invalid scientific procedure is valid, the only reasonable conclusion is that they don't understand it well enough.
You can assume different groups are similar, if you want - and especially if there is no other data, it's a wonderful assumption. But that is your assumption, not the poll's!
An inference (random sample applied to the same population) is not synonymous with a reasonable assumption (random sample applied to a seemingly-similar population).
For the logicians again, this is a textbook category error.
And this mistake is just the beginning of the problem, because election polls don't just have non-binary populations. They don't just have unknowable populations. But they are:
Nonbinary, Unknowable, Changing Populations
So far, we've established two things:
The error of a poll, or any random sample, can only properly be measured by how well it estimated the population from which the random sample came.
A poll can have two options, or three, or any number - and the percentages given by the random sample are probably close to the true population.
But there's a third factor in political polls, because people's responses over time aren't static.
Again with the assumptions (or if you prefer the scientific term, invalid inference): is it reasonable to assume people who say they plan to vote for Candidate A just a week before the election won't change their mind? Absolutely!
Can I assume someone who says their favorite color is “blue” won't change their mind to “red” the next week? Hell yeah.
But those are not valid inferences. Those assumptions introduce a source of error unrelated to the poll.
And with political polls, there's also a non-binary problem not being accounted for.
In my efforts to educate students (and stubborn experts who won’t admit the current methods are flawed):
I've created this illustration and experiment using the color preference example from earlier - in a way that even experts can understand. Avid readers of mine may see where this is going.
Ask a random sample of students: “of the following colors, which is your favorite: red, blue, or green?”
Then, some time later, ask a census of the same population of students from which you took the sample: “of the following colors, which is your favorite: red or blue?”

Zoom in on that smaller circle, and you'll notice some red, blue and green.
Earlier, we calculated this random sample as approximately 45% red and 45% blue, with about 10% green.
But what happens if, between the poll and “election” census, we eliminated green as an option?
On the right, the larger circle, allows only red or blue.
The options changed.
Now, the fun part:
Does that mean the first question is useless?
Given the options of red, blue, and green, some people chose green.
Later, green was no longer an option.
What does the poll data tell us?
The chart again:

It tells us that if we had taken a census of the population when we asked the first question (a simultaneous census), the percentages would probably be close to the 45%-45%-10%.
But later, that “10%” no longer has that option. How will they decide: red, or blue?
A wonderful question. An important question, if you want to forecast the future. But this question has nothing to do with the poll. We've reached the limit of what the poll can tell us.
This is the disconnect between what experts believe and what is actually true.
We cannot make assumptions about which color those who originally favored green will prefer later, when it's no longer an option.
Think they'll split evenly? Maybe.
Think they'll favor blue, since it's closer to green? Great guess.
And that guess is yours. It did not come from the poll. No matter how sophisticated or advanced your model is (or how advanced you think it is) it’s not an inference, it’s a guess.
If your guess is wrong, that doesn't mean the poll was.
Now apply that same exact fact of statistics to “undecided voters” and I've overturned a 100 year consensus of “how polls work.”
*Sarcastic bow*
Currently, calculations made by analysts assume they know how undecideds split, and assert any discrepancy is a poll error. I'll note, because it illustrates the depth of pseudoscience used in the field: analysts in different countries make incompatible, contradictory, and equally unscientific assumptions about how undecideds will decide, and who will change their mind. Not data, not even inference - pure assumption.
From Pew/AAPOR, to Nate Silver, to experts around the world like the British Polling Council- they simply assume their assumptions can't be wrong.
The question is not “if” my analysis is correct. The only question is what to do about it, and how long it will take to be accepted.
Then What DO Polls Tell Us?
Properly understood, plan polls - of which political polls are by far the largest subset - provide an estimated base of support from which we can (if we're interested) build our forecast.
In the present, the poll I conducted above estimates that Red is likely around 45%, Blue is likely around 45%, and Green around 10%.
“But you can't be Green in the Census!”
(I have been told by many analysts that “you can't be undecided in the election though!” as a defense of their invalid methods)
*Deep Breath*
Doesn't matter. Math doesn't care about what you want. Follow the arrow, from the chart you claimed to understand.

You can be Green before the Census. Likewise, you can be undecided before the election. And the poll data applies to that population - the population from which you took the random sample - not a future one with different options.
Somewhat intuitively, though I'm probably the only one who has written about it, due to factors like compensating, compensating error, and masking, this “base of support” understanding both makes sense and is correct. Read about it or ask me about it if you want.
But it is that simple. Follow the arrow, and don't make the mistake of believing your assumptions came from the poll data.
Okay, But Then How To Calculate Poll Error?
To be perfectly clear, if all I had done is disprove the current method, and offered no replacement or correction, it would stand on its own merits. I have and it does. In science, disproving a method (or hypothesis) does not require offering a better one.
But I can, because it's not very hard.
People changing their mind about which option they prefer, and how undecideds eventually decide, are textbook confounding variables to the current calculations.
There are established scientific procedures for dealing with confounders.
The overarching answer? Don't guess about them, dumbass.
Did people change their mind? In which direction?
How did undecideds eventually vote? 50-50, 60-40, 80-20?
We collect data about these confounders, and…account for it. That might look something like this.
In order to calculate poll error, we must calculate what the population looked like n days before the election: one day, seven days, thirty days, it does not matter. This is not an optional step for anyone who understands basic science: we cannot assume confounders are “null, negligible, or known.” Yet currently, the assumption is that no one changes their mind and that undecideds split evenly. I'm not joking or being coy, the current methods say that polls taken close to the election (which different analysts define as two weeks, three weeks, or three months) can be assumed to have zero mind-changing, and that undecideds can be assumed to split evenly.
My work proves that this is unscientific, and I'm offering a better method.
The data we collect after the election can help us backcast what that population looked like at any point in the past.
In practice, I highly recommend Sankey charts that look something like this:

Given this data from the British Election Study, you can see the assumption that no one changes their mind and that undecideds split evenly is false.
Yet analysts still use it, because they fundamentally do not understand inferential statistics. The actual reports from this election literally assumed that no one changed their mind close to the election. As do American reports from 2016. Despite the fact that there’s data that proves this isn’t the case. Does that sound scientific to you?
From the cover of my book:
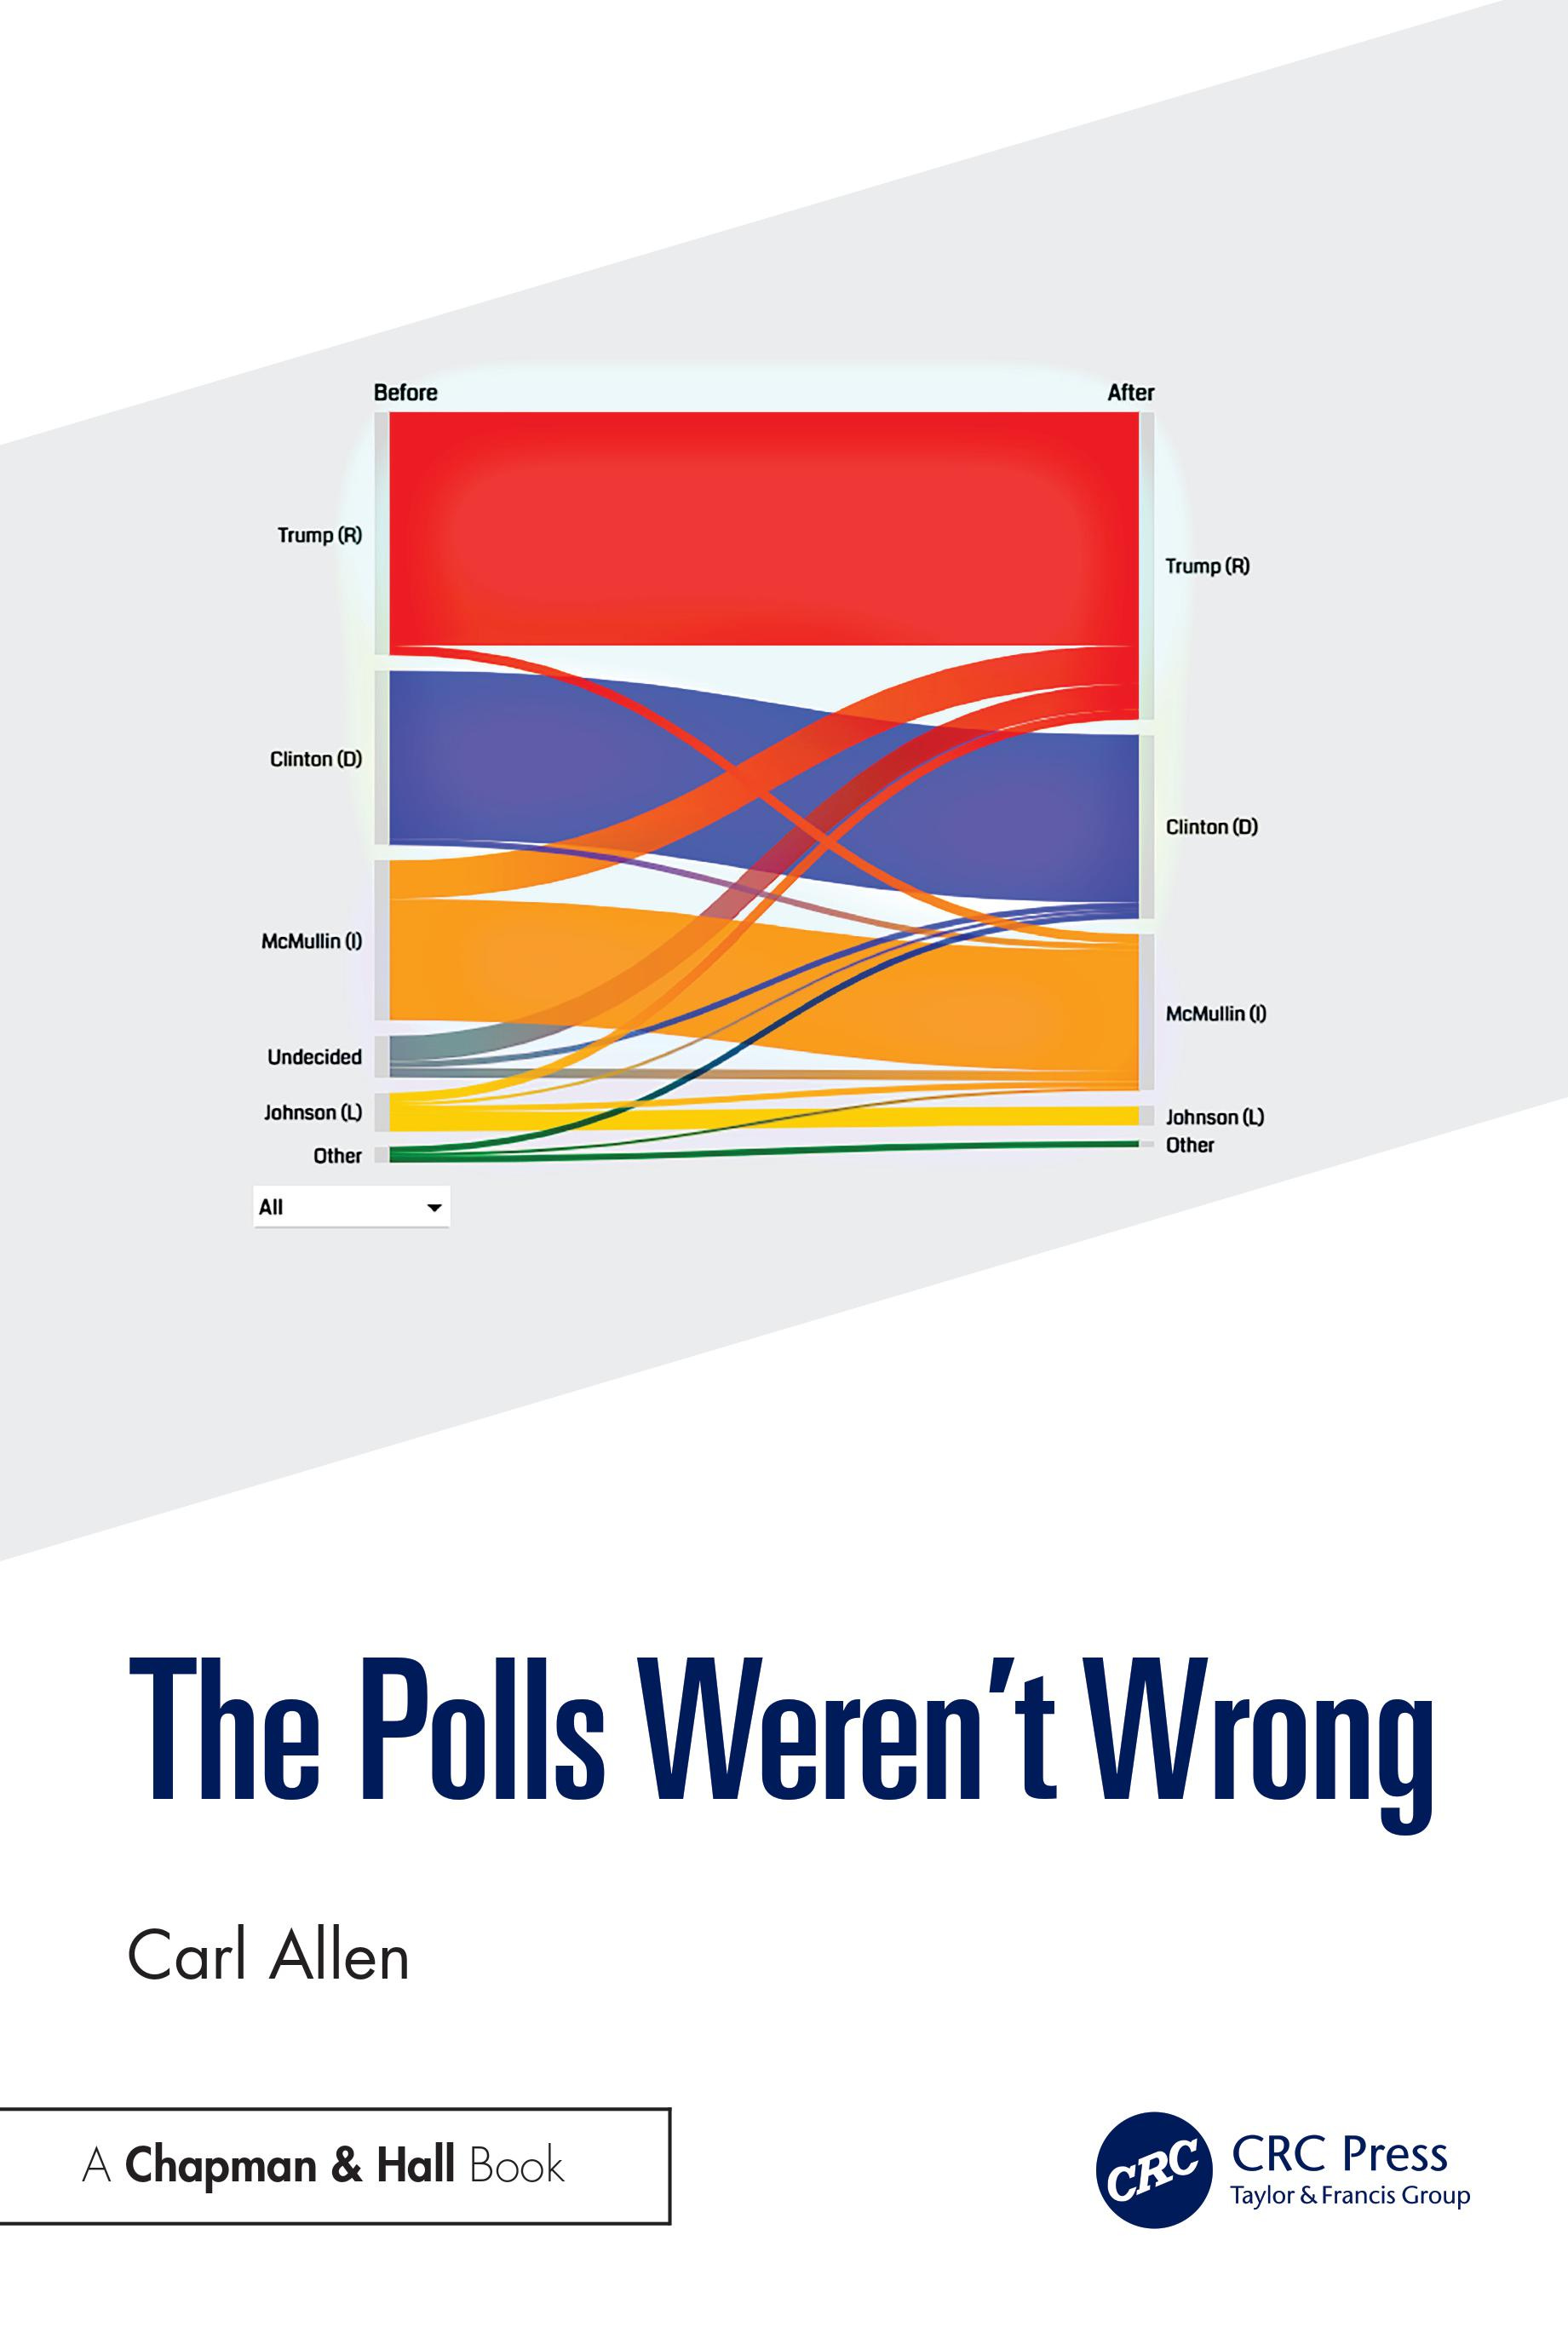
Does that look like no one changed their mind, and that undecideds split evenly to you? According to the current methods, you must assume it to be true, even if you know it's not. I feel like I'm living on a planet where bizarro statisticians have been relegated to poll analysis.
While most analysis around the alleged 2016 US Presidential Election “poll error” focused on the traditional swing states, it was Utah that is said to have had the largest error: it contributed a whopping 10 points to the pseudoscientific “statewide poll error” calculations published by FiveThirtyEight and AAPOR. Not only did I prove that they were wrong, I proved why they were wrong. Science is fun.
The Big Picture
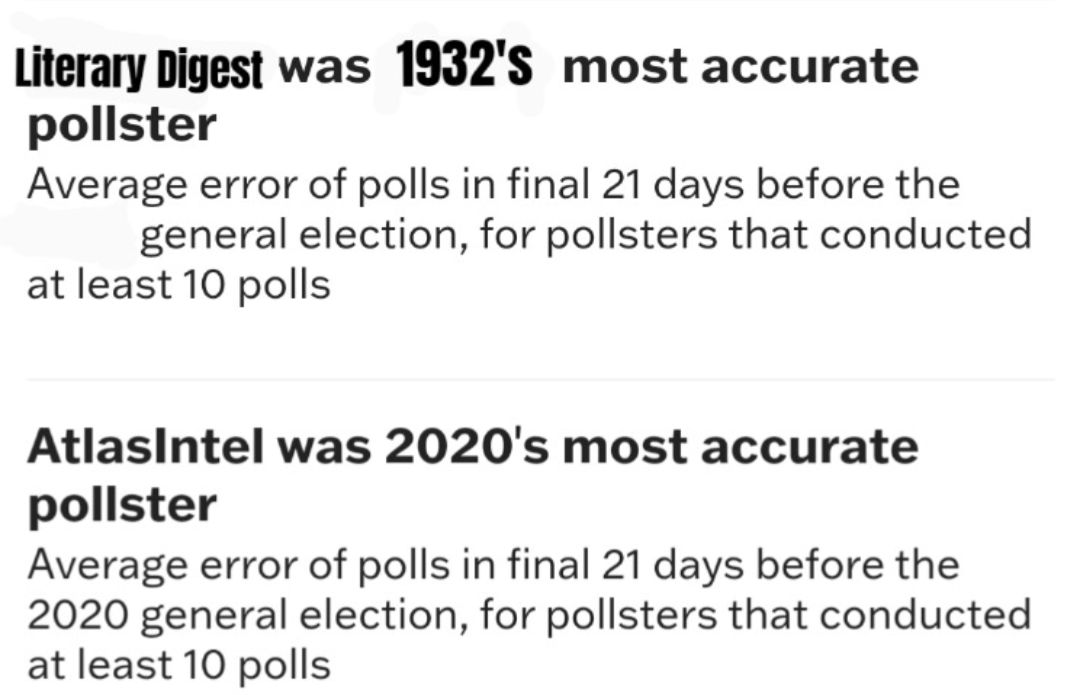
Experts don't just make these mistakes in passing or without consequence - they build models based on them, publish scorecards, and shape public trust based on these flawed premises. They misinform the media. They declare who the most accurate and least accurate pollsters were based solely on this analysis that is easily proven as invalid, on the somehow more unscientific standard of using a sample size of one election.
When a pollster "misses," they are often accused of error regardless of reality, while others are celebrated for being "right" when they merely landed closer to the final vote by chance. 1916-1936, 1980 and 1992 and 2016 should've served as a warning for this, but no one saw it, because they didn't understand how polls work. And still don't.
High quality pollsters who don't “predict the result” are demeaned and forced out, and less rigorous pollsters are happy to take their place. After all, if they predict the result once or twice or four times in a row, they must be good, right?!
It’s statistical cargo cult science: mimicking the appearance of rigor while ignoring the core logic of uncertainty, probability, and epistemic humility.
Fortunately, it's not hard to fix. And anyone who cares about good science should demand that it be fixed.
Contact
, American Statistical Association, any of your country's orgs on public opinion research, or anyone in a scientific field that cares about proper science and tell them to read my work…and that I'd love to chat.Read about the simultaneous census standard
And why saying “polls underestimated” some result is proof of ignorance
Or watch me talk about this stuff
Or contact me to talk about how to fix this, scientists and media.
Hi Carl. I like the way you think here. This roughly aligns with my understanding of freqentist and inferential stats. It's disheartening seeing media personalities speaking from a place of naivety or ignorance when presenting polling information. I'll put your book on my reading list.
Ok, I'll bite.
Given the same values for p and z, why are there 4 different values of n that produce the 4% MoE?
If I solve for n with p=.5, z=1.96, and MoE=.04, I get 600.25 which is more or less what you listed for the final chart. Where are 86, 486, and 588 coming from?