I try to be a force for good among the chaos. I have refused to publish a live/daily forecast update, because there is simply no justification (from an analysis perspective) to do it. That's not to say I never will, just that I'm opposed on principle, while I can afford to still have principles.
It should take a lot to move a (good) forecast in a high-data event more than a few points in a day. If you want to know my current forecast, the most recent one (usually only a week old!) is probably very close.
But you all, greedy, have begged me for constant updates.
I don't want you all think I'm immune to the desire for content: when new polls come out, I want to see them.
It's natural to want to know what this newest poll means (never much) or how it changes a forecast (likewise).
If I come across as calm or extremely rational, don’t let keyboard Carl fool you: it's not because I'm not anxious, it's because I've come to terms with what I am (addicted to the chaos) but also that the day-to-day stuff is mostly noise.
Weekly. Weekly is enough. If I could force myself to only look at election data weekly, if not for people relying on me to be very well informed about all kinds of weirdly specific stuff like Likely Voter screens by pollster or voter registration rules by state, I'd take that deal.
But now, we're inside of two weeks…I'll dig a little deeper into some possible outcomes - from comfortable Harris wins to narrow Trump wins - and post updates more regularly.
See my last Presidential forecast here (with popular vote)
The Headline
Harris remains a medium favorite, 65% to win the election.
The reason:
Her advantage in the blue wall states is not “comfortable” but it is real.
Without getting into the debate about okay versus indefensible Likely Voter screens, or the near-certainty of herding, she's simply more likely to get to 50% of the votes.
Her poll average in each of the blue wall states is under 49%, but not by much. (48.8 in PA, 48.8 in MI, 48.3 in WI) while Trump is under 48 in all 3.
This does not, in itself, make her the favorite - but with very few undecideds (who may favor Harris) the math is simpler this year.
Plus, in elections with third parties receiving a meaningful percentage of votes in polls (say, 5%) it becomes challenging to forecast how many votes they'll actually get - usually less than their polls - but 4%? 2%?
How many votes third-parties get directly impacts the percentage of votes needed to guarantee victory - the “finish line.”
Third-parties are not too strong this year.
49.5% will likely be needed to win all of the swing states. Some states a little higher, others a little lower.
The “finish line” can be expressed two different ways.
While Harris may be slightly “ahead” in my poll averages, that does not mean my forecast assumes that she definitely is. For a simplified (but accurate) look at how forecasts work, you can read about it here.
Poll errors (properly understood) are not uniform across states, either. It's entirely possible (for example) that Harris is much stronger than polls indicate in North Carolina and Georgia but weaker in Pennsylvania and Wisconsin - or vice versa.
More correlated states are more susceptible to more correlated poll errors, for the same demographic reasons. A two-point simultaneous census overestimation or underestimation in Pennsylvania would likely mean a similar one in Michigan and Wisconsin. But it does not necessarily mean there would be a similar (or any) error in other swing states.
Other forecasters continue to characterize the race as a tossup.
While my forecast is more favorable to Harris in the Blue Wall, it also believes that if the blue wall narrowly cracks (she loses one state, but not all three)
That Wisconsin is the most likely culprit. Wisconsin, with 10 Electoral Votes, is the easiest of the blue wall states to “patch”
Any one of North Carolina, Georgia, or Arizona would still get her to 270.
The math becomes more complicated were she to lose, say, Pennsylvania AND Wisconsin. Very bad for her chances, but it doesn't mean she has lost Georgia and North Carolina - though her win probability would be extremely low.
Why?
States are correlated, but…
Unlike Silver's forecast that assigns a probability near 50-50 that either one candidate or the other wins all 7 swing states, mine seems to indicate more variability.
(Edit: Silver has it at 40%, another forecaster has it at 50%)
The three blue wall states tend to go together
Georgia and North Carolina tend to go together
Arizona and Nevada, too, but Arizona is looking a little disconnected this year.
Yes, they all do tend to go in the same direction, but I'm not convinced that even if either candidate outperforms their expected poll numbers by 2-3 that all of the states go their way.
“Not Arizona” and “Not North Carolina and/or Georgia” show up rather often in my forecasts. “Not Wisconsin” for Harris and “not Michigan” for Trump, also.
Like the poll averages I assign have error bars, the correlations I assign to each state also come with error bars, some larger than others. It's possible, for example, Arizona gets “redder” in the Presidency for this election cycle while the country gets “bluer.” It's less likely that Pennsylvania would follow that trend.
Plus, if the election is extremely close (possible!) we could be looking at a weird map. Remember, although the blue wall states tend to go together (binary thinking) the reality is, in 2020, Democrats won:
Michigan by 2.5
Pennsylvania by 1.3
Wisconsin by 0.6
There's some probability in a close election that they don't go together, despite being highly correlated.
I'm higher on Democrats in the blue wall, but my forecast is pretty close to FiveThirtyEight in the other four swing states.
As I outlined in my last forecast, if Democrats lose one or two of the three blue wall states, Georgia and/or North Carolina are viable backups. I don't think a narrow loss in any of the blue wall states is “game over” - though it would make for a stressful week.
If Democrats win all three in the blue wall, however, that is “game over.”
The Range Of Outcomes
There are two ways to visualize the election.
One are the “bins” or number of Electoral College votes I've used since my first forecasts:
I like this because it illustrates where the “cliffs” are - outcomes that go from possible to highly unlikely.
But there's another useful way to look at the ranges of outcomes.
The “betting markets”
I have lots of thoughts on prediction markets, especially related to election outcomes. They're not efficient. Whether you believe my forecast for this specific election or not - it's pretty indisputable that they haven't had a good track record of late (or longer) in political applications.
Are prediction markets better than the average person's best guess? Probably, usually. But they're not nearly as efficient as a sports betting market.
Plus, they're subject to all kinds of biases - when the biggest markets only accept cryptocurrency, for example - their client base isn't exactly a representative sample.
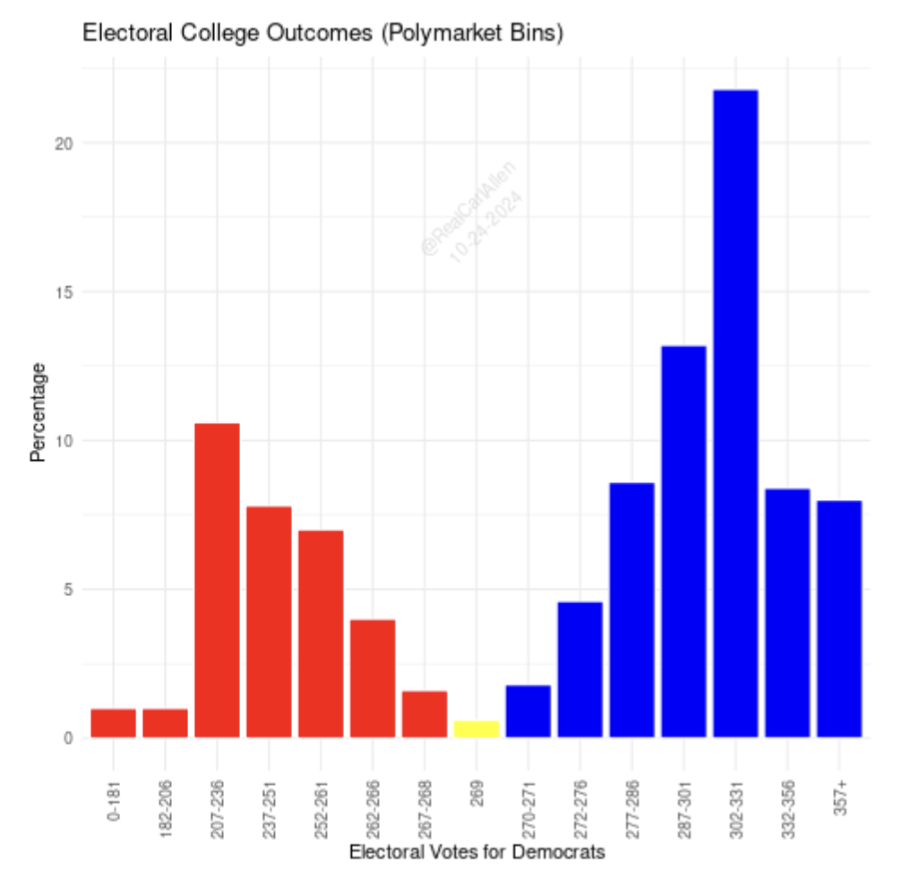
Here is my “betting market” visual
The betting markets allow wagers on a range of Electoral Outcomes. Here's my forecast presented the same way they accept wagers:
That 302-331 bin (Dems win by 65-104 Electoral Votes) includes two of the most common outcomes (303, 319) and one that is also fairly common (308). I give it a probability over 20%, betting markets only 9%.
On the red side, prediction markets think Trump has a 31% chance to win by 65-104, while my forecast has it at just over 10%.
Trump's most likely victories, in my forecast, also more commonly a mix of “most” of the swing states.
What about early vote?
Most common question I get, and a good one.
The short version: it won't be incorporated into my forecast. A good forecaster shouldn't incorporate it into theirs, either.
Why? Isn't actual vote data better than poll data?
Yes. Much. But the lack of “knowns” in that data introduces wide error bars and require stacking lots of assumptions.
I'll explain why
In past years - say, pre-2020, elections had been mostly similar. There were patterns. We had historical “comps” from which we could estimate turnout, motivation, and more.
Democrats have always tended to vote earlier than their Republican counterparts.
But remember, 2020 broke records for mail-in voting due to COVID. Democrats still voted earlier more, but it was such an outlier that trying to use that data to figure out what 2024 data means is not a good idea.
Even harder:
2024, for the first time Republicans are actively encouraging their supporters to vote early.
Yeah, even that guy.
So how do you account for something unprecedented?
The math ranges from impossible to very hard.
The best we can do is say “this is probably good” or “this is probably not good” but the uncertainty is so high that even if the data looks good, it could be bad - or vice versa.
The cannibalization of Republican votes - getting people who are definitely going to vote Republican to switch from Election Day to early will be a significant number. But “how much?”
(Note: cannibalization sounds like a bad thing, but it's not really - one vote is one vote no matter when you cast it - voting earlier is always better from a strategic standpoint)
Impossible to say for sure. It will make Election Day interesting if Republicans don't run up their usual margins that day though
So I'll keep following the early vote, you can too, but be wary of letting anyone convince you that it shows something definitively good or bad for any party at this point.


A few quick comments... pretty much 100% vibes:
Current polling is quite depressing. And slightly contradictory. On recent trends, the NPV looks like a tie, and a tie / small Harris win there is a defeat in the EC. Polling in the swing states is holding up better, so either the split is much, much smaller this year (Florida vote sink?) or something doesn't add up.
I buy that Reps voting early at much higher rates makes any attempt at reading the early vote useless.
I feel that Harris' best chance now is record women turnout. White college voters won't be enough to balance the latino and black loses, although on the while I think they won't be that different from 2020. But Dobbs happened after 2020, and women do know who put those justices in the Supreme Court.
One thing that really bothers me about the "Sure, Trump has momentum and maybe it's from Repub pollsters flooding the zone, but it's still within the margin of error so it doesn't matter!" is that is assumes [1] a collective understanding of how polls work and [2] the election will be called fairly and without some sort of legal hijinks.
[1] ranges from a bias among the statistically literate to an ignorant fantasy. Especially with the election being a 50/50 this whole time, it is way too easy for someone look at election odds and say "Trump was ahead by 6% just two weeks before the election, RIGGED!" and it catch fire as a completely valid thing to say. It DOES NOT MATTER how many times you remind people in the subtext that these are odds, not polls, a massive group will still misunderstand, and these "50/50" forecasters will be partially responsible when they do.
[2] the above makes this scenario that much more dangerous. When the election still too close to call on November 7th and the legal challenges begin, the narrative that Trump "had momentum" leading up to the election is going to be the broken record for everyone arguing for the Trumpist interpretation of whatever election disputes exist. They will have been allowed to fabricate a narrative, have it laundered through 'academically informed' sources, and point to that as evidence to justify a fascist takeover of government.
Thank you for presenting an alternative view, but please, be way more critical way more publicly about how certain figures are being allowed to nudge public perception towards 50/50 because that makes the betting market more interesting. A forecaster has every incentive to present the race as the most defensibly controversial version that exists.