A General Election is expected in the UK in 2024.
As I've written elsewhere, poll data in the UK is catastrophically broken.
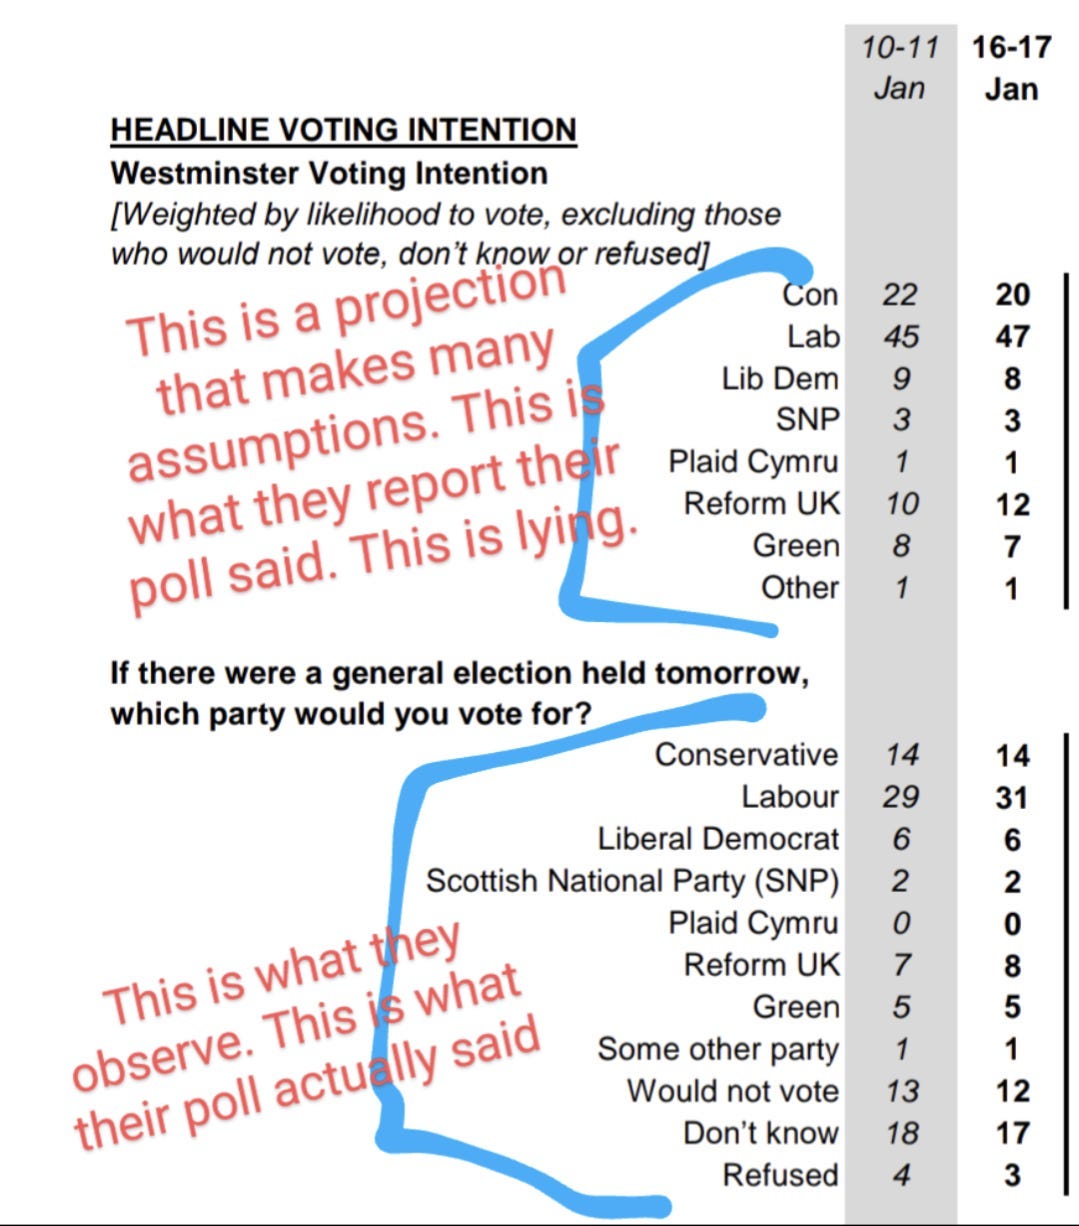
Due to the tradition of lying about poll data via the proportional method, both experts and the public just implicitly accept that people who are “undecided” don't matter for their reporting, despite the fact that they are regularly in the teens (sometimes higher).
To make matters worse, them clearly don't understand the difference between polls and forecasts, which leads to public distrust of poll data, despite the fact that the poll data is mostly good, and the forecasts (which they lie and report as polls) are abysmal.
Poll reports in the UK consistently fail, and will continue to do so, until they learn the difference between polls and forecasts.
Tees Valley
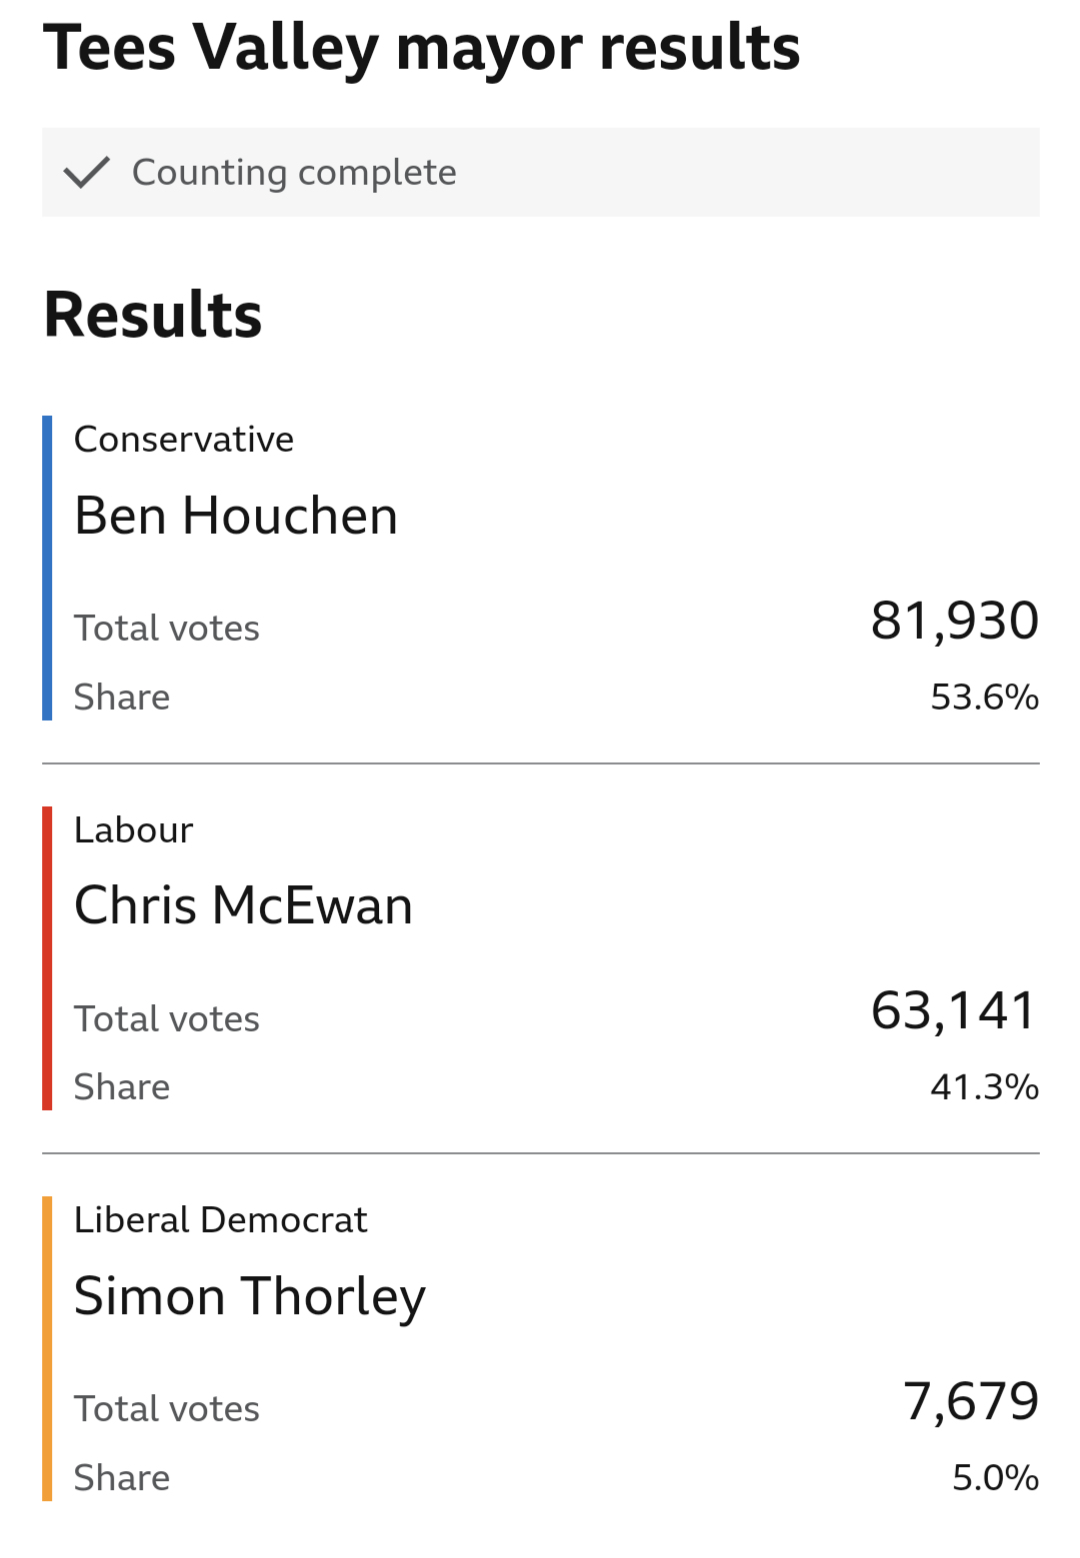
Results from the Northeast come in first, and this one wasn't terribly bad for the pollsters masquerading as forecasters. About 2.5 under on Conservative and 2.5 over on Labour.
Considering a 3-point miss for each candidate was enough for the British Polling Council to analyze “why the polls failed” in 2015 (they didn't figure it out, and adopted increasingly pseudoscientific practices as a result) they would be less forgiving than me.
The “margin” in that “voting intent” pollcast was +7 for conservatives. They won by more than 12.
A Labour underperformance (current General Election polling leads pollsters and media to report “it gonna be a landslide 🧐”) is something that would be considered a “poll failure” but is nothing more than another predictable failure of the proportional method.
And here's what another pollster put out:
Oh no.
Absolutely enormous miss. Projected to be extremely close, and it was a double digit win.
Because they don't understand the difference between polls and forecasts.
Things are worse for the continuingly failing pollcasters elsewhere.
North East
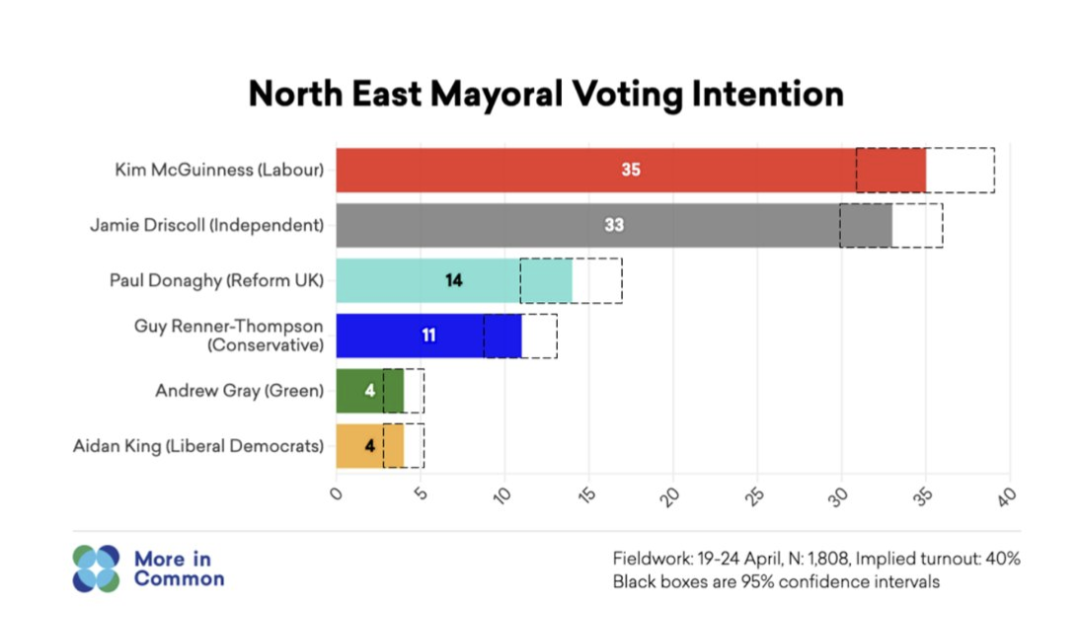
Here, this pollster gave a confidence interval for their data. Science!
They said Labour should finish between 31-39, and the Independent between 30-36.
Fairly wide range, but this is - properly done - what a good forecast would look like.
The result:
Both major candidates finished a full 2 points outside the “95% confidence” interval. That's a lot, given the +/- 4 and +/- 3 respective margins of error.
This is not, in itself, proof of a poll failure. Results outside the margin of error should happen as frequently as the confidence interval suggests.
Here's the problem.
The pseudoscientific process (proportional method) adopted by alleged experts in this field leads to results consistently outside the margin of error.
If your method consistently disagrees with reality, your method has failed. But tradition and “the way we've always done it” doesn't allow them to fix anything. It will continue to fail catastrophically.
By not understanding the difference between polls and forecasts, they make simple errors-of-fact that lead them to assigning indefensible “margins of error” and “confidence levels” that supports the hard to believe conclusion that they don't know what the margin of error is in a poll, or what it applies to.
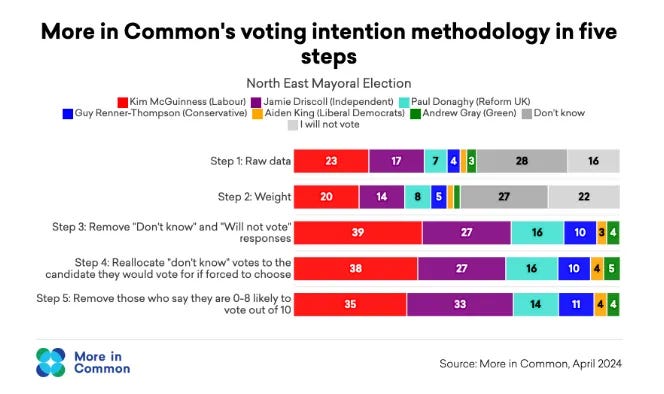
Here, in a rare glimpse under the hood of this unscientific process of “allocating undecideds,” and claiming this assumption represents the poll, the pollster who wrongly assigned a “95% confidence interval” shared this:
Here, a whopping TWENTY SEVEN PERCENT of voters reported being undecided.
There were more undecided voters than declared support for any candidate.
In case you're new to basic arithmetic, Undecided Voters have a known and calculable impact on the range of possible outcomes: the more they are, the more variable the outcome can be.
It should make sense that given, say, 27% undecided, the range of possible outcomes is much higher than if there were only 2%.
But due to the fact that these “experts” don't understand the difference between polls and forecasts, they don't understand that. Which leads to them assigning WAY TOO CONFIDENT “95% confidence intervals” which will continue to fail.
York and North Yorkshire
I'm told this election is interesting because it's the home territory of the current, Conservative Prime Minister. The seat was favored to flip to Labour.
The seat did flip to Labour, but this is an even bigger miss for the pollcasters.
A full six points over on Labour vote share, and five under on Lib Dems. But hey, they got the Conservatives dead on!
East Midlands
I'm not always mean. Credit where it's due here: spot on for Labour and Conservative
Oh no.
Reform finished under 11%. The 95% confidence interval only went down to 11%.
Seems like “95% confidence” isn't very close here. Why could that be?
And in case you're thinking “oh, they barely missed” that's not relevant to a 95% confidence interval.
Outside of it is outside of it.
London
There are one or two other potentially “swing” seats, but this is obviously the big one.
Now, it was never a serious consideration that Khan, the Labour Incumbent, would lose (though it remained a small possibility) but the pollsters leading up to the election mostly reported huge “leads” for Khan.
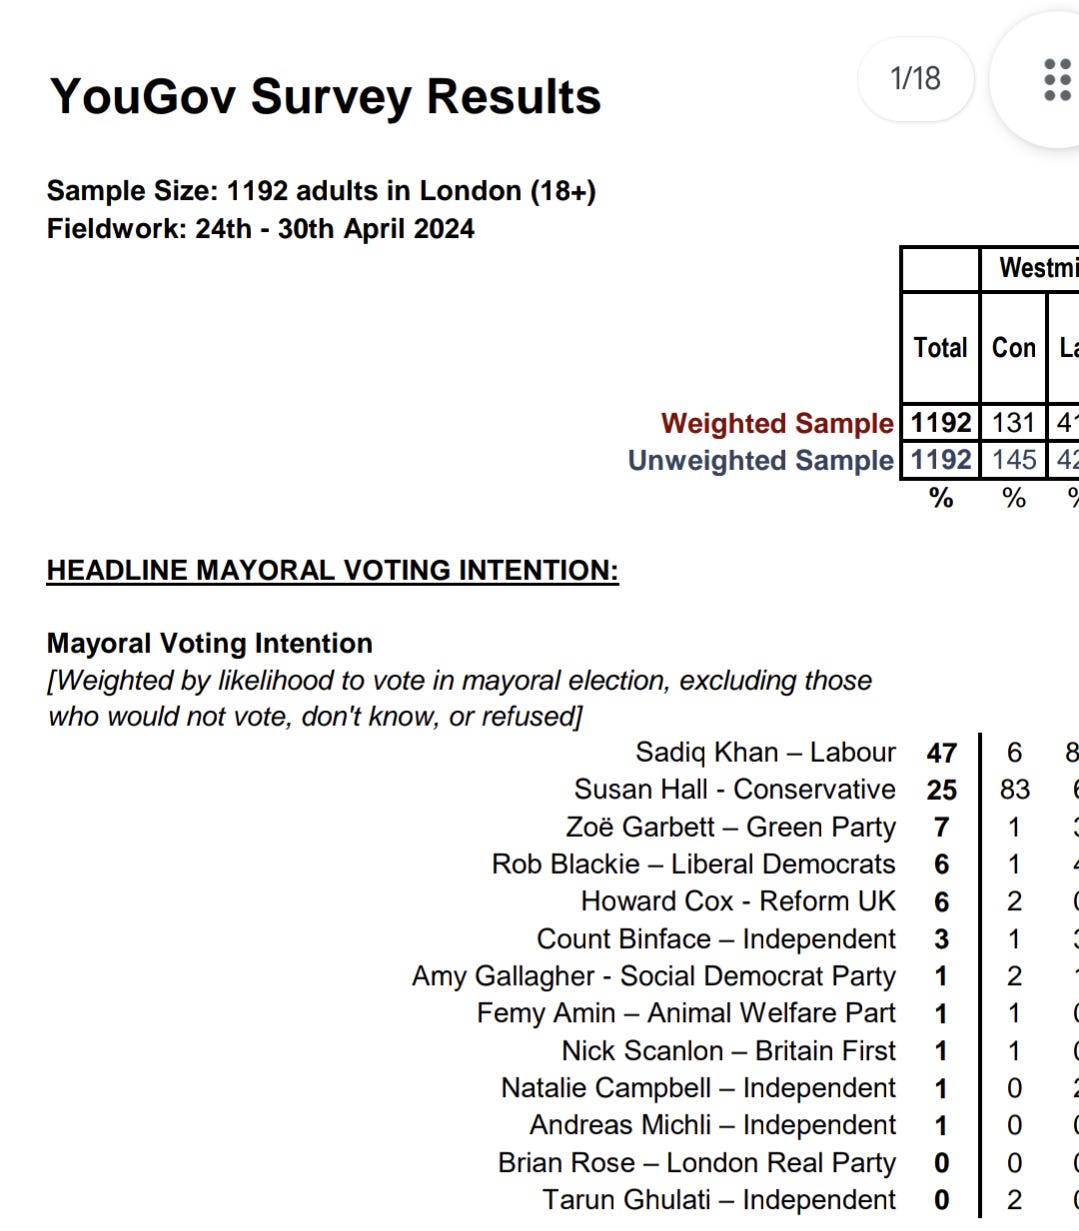
YouGov, being among the first to commit to the lie that polls are forecasts (using a method called MRP) put out this vomit that led them to conclude “Khan up by 22”
The problem, as with all people who don't understand the difference between polls and forecasts, that's not what their poll observed.
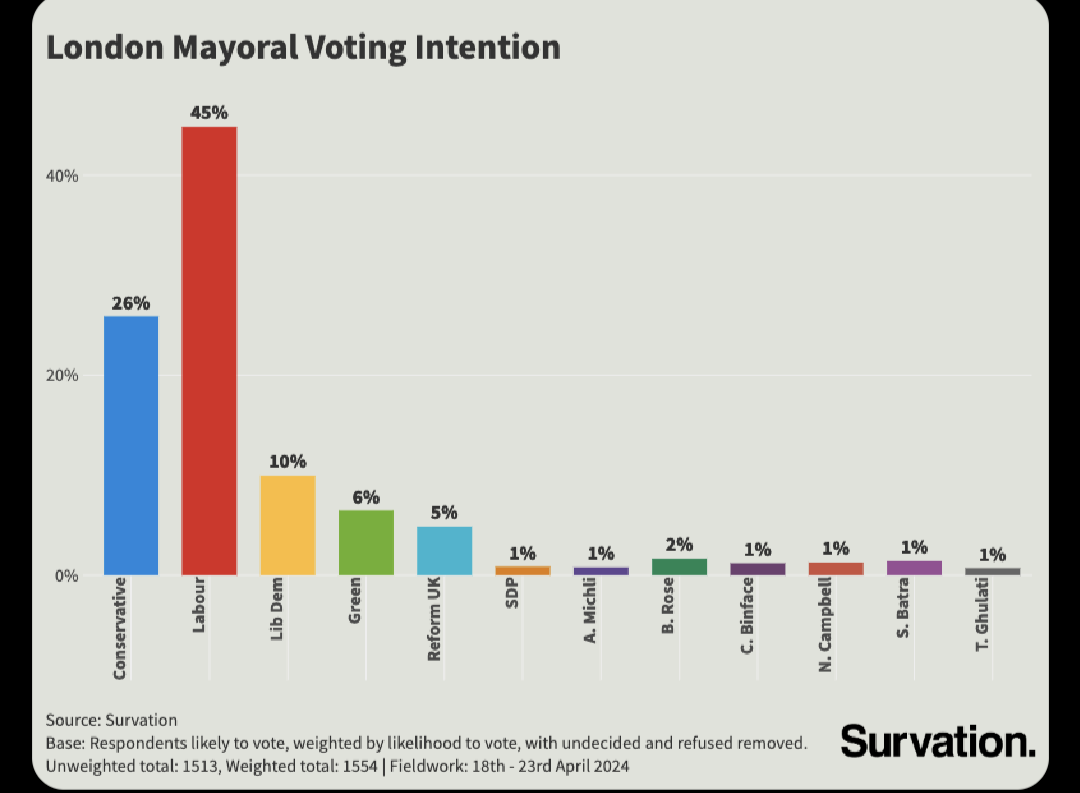
Same lie, this time by Survation.
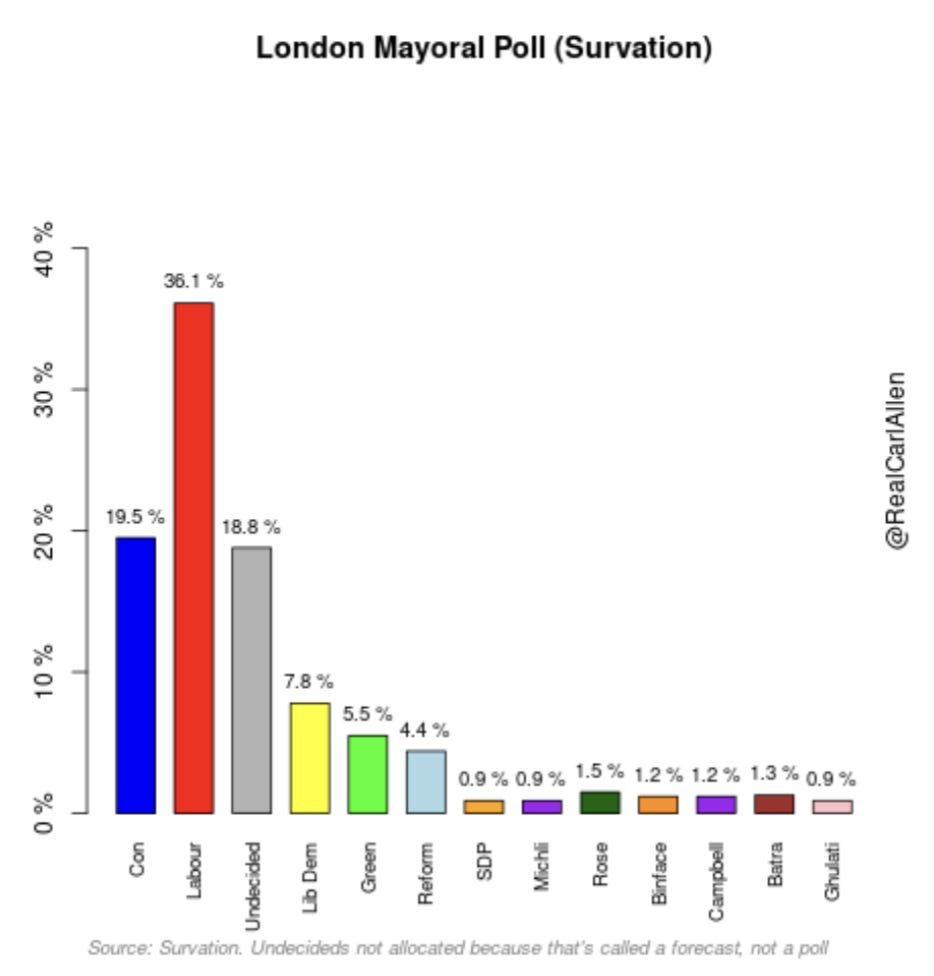
This is what Survation actually observed:
Big difference.
YouGov observed similar number of undecideds, around 20%.
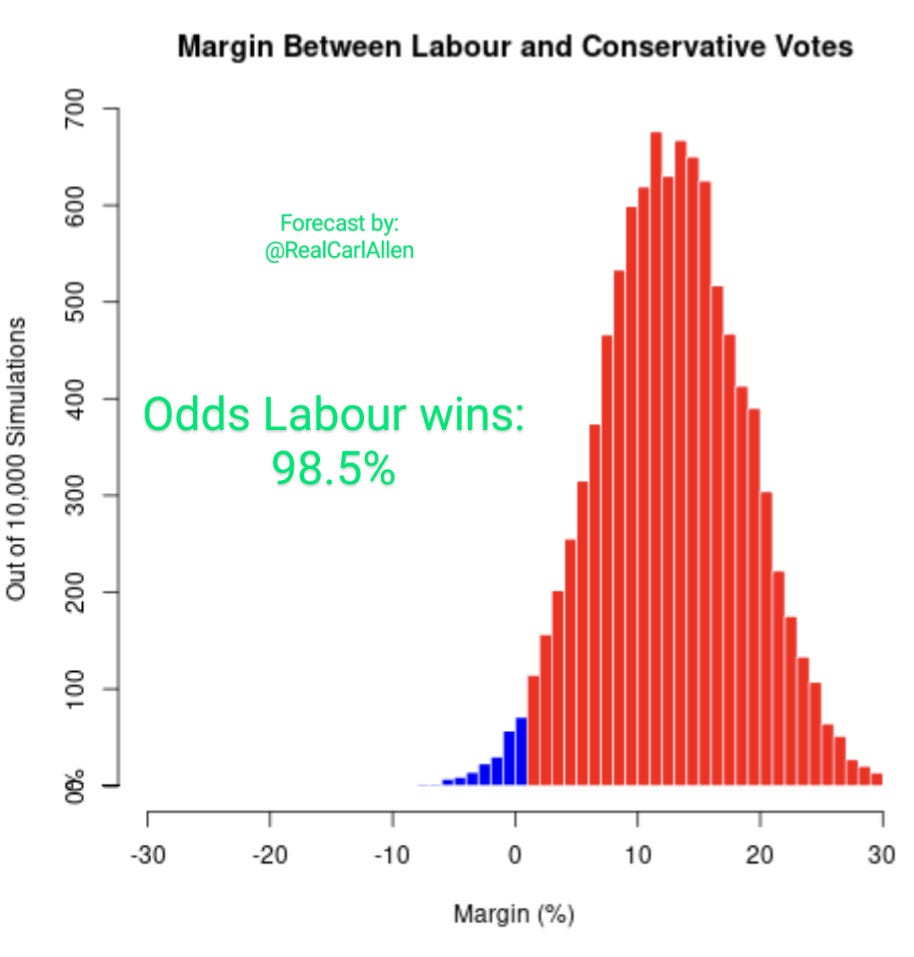
I used this data to inform my forecast, because I know how math works. You can read more about my forecast here.
Experts in the UK clearly do not.
The assumption that undecideds would split proportionally to decideds led to the conclusion that Khan’s lead would increase from what the poll observed.
This is a horrible assumption.
Your forecast can assume that, if you want, but conflating it with “what your poll observed” is lying.
In 2021, Khan won the first round of voting by about 5%. Changes in the electoral system in the UK made this the best comp/baseline.
It was pretty hard to see Labour doing worse there (though, still, not impossible) but my median forecast had them winning by about 13.
Because there are a lot of undecideds, and only about 3 polls, there's a lot of uncertainty.
Good models incorporate the most likely outcomes, and account for the possibility they're wrong. This range of outcomes is reflected in my forecast. 95% confidence in my model would've been something like a Labour win by 2-22 (or Khan finishing between 39-47). That's a wide range - and it should be. My forecasts will be within the 95% confidence level about 95% of the time. That's how math works.
Shitty models, who start with the assumption that polls and forecasts are the same thing, are so overly confident the public is led to believe the polls were wrong - when the reality is their forecasts were. For example, where McGuinness finished at 41:
Counting in London opened with huge numbers for Khan, but they were from Labour-friendly constituencies. He outperformed there.
Later, more “swing” areas - that narrowly favored Conservatives in the past - flipped to Labour.
Then numbers started coming in from Conservative-friendly areas, and while they didn't overperform there, they didn't underperform much, compared to 2021.
Here is what appears to be the final result:
That's Khan by 11.
Ouch.
And here's what my forecast said:
Pretty good.
The assumptions made by pollsters masquerading as forecasters are indefensible. The proportional method is unscientific garbage and needs to be done away with forever.


