I started writing this before the news. No not that news, the Biden dropping out news. The swap is probably favorable for Dems, though the short term contrast between likely-candidate Harris and Biden isn’t as steep as the media hyped it to be, there is probably more upside. But that doesn't matter, now.
Am I concerned about releasing it today, instead of last week, or should I wait until things settle? Not really.
Other forecasters have frozen their forecasts, for good reason, but I didn't release mine too early in part because of the Biden uncertainty. My forecast (being a forecast and not a nowcast with error bars) incorporates what I believe is most likely to happen in the future.
If things trend exactly as I project (a probability I've assigned a very small chance) my forecast won't change. If things trend better or worse for Dems than I expect, my forecast will move.
Biden, with questions around his campaign abilities, limited that regression to the (positive, for Democrats) mean. Harris is a more reliable candidate, and shifts the conversation to the abilities (and inabilities) of the other guy.
If Dems make a strategic move adding Cooper, Kelly, or Shapiro to the ballot as Vice Presidential candidates, it could move things, too.
VP candidates don’t move the ticket a ton, but 1-2 points in states like North Carolina (where Cooper is from), Pennsylvania (Shapiro), or Arizona (Kelly) would move electoral win probabilities. I'd personally be a fan of Whitmer on the ballot but I don't think she “perceptually” evens out the ballot for the Biden “white working class” coalition Dems are chasing.
I mean, two candidates of the same gender? Crazy!
My forecast will likely move more closer to the election than any other time, because that's when many voters tend to decide, when more quality polls come out, and less math needs to be done to figure out what numbers candidates are “regressing” towards. A 10% win probability move in July is less meaningful than a 5% move in November: the latter is made with more confidence.
I can promise, however, my forecast won't move 14% overnight the day of the election because another forecaster changed their forecast.
Now the good stuff
July 21 Forecast, overall
Win probability
Democrats: 58% Republicans 42%
This is rounding away the 0.5% chance of a tie, which has a couple possible maps.
Now, it's still July and I'm very much on the record (and I'll reiterate) that July is too early to make authoritative Presidential forecasts.
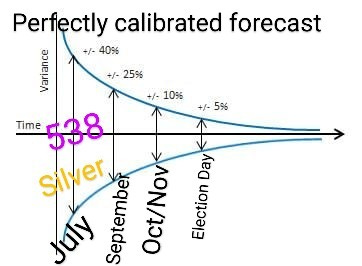
Anything between 28% and 88% is, in my opinion, defensible right now. Not worth arguing over. You can see the illustration below, +/- 40% is probably too wide at this point, but again, it's an illustration. This is not an argument against forecasting this early, I can forecast the weather for Election Day too, but even the best possible forecast can't claim it knows what the weather will be (even within 10%).
There's simply too much time and not much data. When Silver criticized his former employer’s forecast for, basically, weighing fundamentals too much (which he calls “vibes” now) he expresses a undue level of confidence in poll reliability this early. Not to mention, his usual misplaced and unscientific obsession with “spread.”
It's true that, a few months ago, I was much more bullish on Dem chances. Prior to Biden's troubles, there wasn't much data to suggest Dems would do much worse than 2020. No, junk historical trends don't matter for 2024 any more than they mattered in “midterm trend” 2022 in which Dems gained in the Senate. And I don't want to hear about the “margin” in the polls.
But after his struggles, with Biden at the top of the ballot, I worried about some people defecting to third-party, or not voting (not necessarily defecting to Trump). There was increasing data to support that. Concerningly for Democrats, the debate was more about Biden's age than Biden's (many) wins.
With Harris at the top, I think that positive direction is more likely to return. But it's not a guarantee. While the Trump ceiling is real, Kennedy on the ballot could leach double-haters from a Harris ticket in swing states.
In 2016, Trump picked up just enough from undecideds, and third-parties took just enough from Clinton, to keep her under in swing states.
In 2020, though Biden's performance was not as strong as the Electoral Map made it appear, there were no major third-party “copouts” for double-haters. Trump picked up a bit of support here and there, but he was just pushing on the ceiling. Biden probably won the majority of double-haters.
All of that is to say, if “never-Trump” voters have an out, Kennedy - like Johnson and Stein in 2016 - gives them one.
Kennedy dropping out (regardless of who he endorses, if anyone) would nudge things in Dems direction. Right now, there's a chance third-parties combine to pull 10% in some states, making the threshold for a major party candidate to win 45%. There's also a chance coalitions solidify, and the third party numbers are closer to 3 or 4%. Those possibilities are accounted for in my forecast.
It also incorporates Dem downballot strength, because it's unlikely (for example) they win a swing state Senate seat by 6 points but lose the Presidency in it. I had to create a Senate Forecast to incorporate into my Presidential forecast, and I have no idea how the other guys don't.
Silver has stated he probably won't do one, and Morris said a colleague did theirs in 2020.
For all their (rightful) obsession on interstate correlation (if a candidate overperforms expectations by 2 points in PA, they've probably also overperformed by a similar number in similar states like MI, WI)…they seem to not account for INTRASTATE correlation.
Is a swing state Senate candidate really going to run far ahead of the President?
While the presidential polling in 2024 so far has been weird because of the uncertainty and desire for a new Democratic candidate, the Senate polling is fine. Established candidates, etc. That's a good place to look if you're trying to get a feel for voter sentiment: statewide data. It's too early for polling to be taken too seriously, but Senate Dems running consistently ahead of their Presidential counterparts in the same polls isn't noise. It also helps manage where the Presidential “undecideds” lean.
For example, Bob Casey will help Dems in PA in 2024 (and so might some other Senate candidates). My forecast incorporates that. It probably overestimates Dems in Ohio because Sherrod Brown could easily outrun Harris by 10, but it may underestimate them in North Carolina (who has a contentious governor's race, in which the Democrats will be favored, not factored in yet).
Also, it does not, yet, incorporate the abortion referendums which could also boost turnout for Democrats and make states like Florida really detached from the national trends. That referendum needs 60% support to lift the abortion restrictions currently in place, and likely will do so comfortably.
It will incorporate data like that closer to the election, because even a small move could change things. I'll update all of these things as there is more data, but I'm happy with it for now.
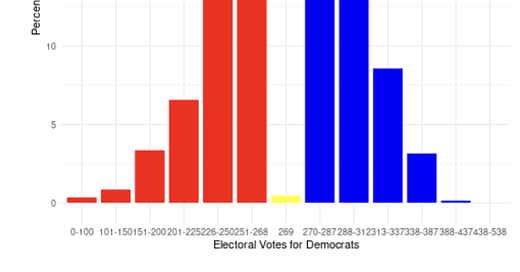
For now, here's what I have as the range of likely (and unlikely) outcomes:
Narrow D wins, narrow R wins, all dot the most likely outcomes. For visualization, I put them into “bins” to show ranges.
FiveThirtyEight defines “landslide” as 350+ Electoral Votes, which I have rather unlikely right now (under 5% for either side).
For Democrats, that landslide map would basically include all lean states, tossup states, plus the stretch states, plus some permutation of Florida, Ohio, Texas, and North Carolina. And it's entirely possible they pick up a state like North Carolina but don't hold, say, Georgia.
All of those states are reasonable independently, but getting most or all of them I don't think is in the range of 20% (FiveThirtyEight currently has 22%, more than 1/5 elections). It's early, but those crazy wide tails are kind of their thing. (See the bottom of that link regarding their 2022 Senate forecast range of outcomes)
On the other side, for Trump to get to 350+, he would need to pick up all the lean and tossup states, plus all of Virginia, New Hampshire, NE-2, and (I guess) Colorado?
Again, this probability is far greater than zero - I have it around 4% - but idk about 13%.
Anyways
Here are the state-by-state probabilities
By my estimate, there are currently 14 states rightly called “battlegrounds” in which both candidates have a win probability of 10% or greater.
State Dem Win Probability
Florida 11%
Texas 16%
Ohio 23%
North Carolina 39%
Georgia 45%
Arizona 48%
Wisconsin 55%
Nevada 59%
Pennsylvania 62%
Michigan 64%
Nebraska 2nd 67%
Minnesota 70%
New Hampshire 81%
Virginia 90%
I'll post the median vote shares and range of outcomes closer to the election.


Great assessment as always. Gives me and the people I care about a reasonable amount of hope :)