
Statistics Don't Lie
People Who Don't Understand Statistics Are Easily Lied To

The saying “Lies, Damned Lies, and Statistics” is one most people believe to be true, because statistics are so often used to lie and mislead.
But I'm here to tell you, it's not that simple. And after giving it some thought, I've concluded it's not true at all.
Statistics cannot "lie" any more than long division can. They can only be misunderstood or logically invalid.
The problem starts with the fact that statistics and probability - overlapping but unique fields - are not that complex on their face, especially at the introductory levels. Most individuals who have conquered calculus, differential equations, or astrophysics find it offensive that you would question their comprehension of something so basic as the margin of error formula, for example. Because the calculations seem so simple, users mistake computation and familiarity for understanding.
Indeed, there are a lot of publications by “experts” whose own words prove they do not understand what the margin of error in a given calculation means…and apparently no one bothers to correct them.
Statistics do not lie, but people who do not understand statistics are easily misled.
Lesson 1: What the Data Mean is More Important than What the Data Say
I have read Feynman, Box, Sagan, Asimov, and many other influential scientific educators. I have no doubt, however, that I have read only a miniscule fraction of what exists and stimulates scientific thought.
That being said, I contend that there is no idea more profound, important, and influential in this field - perhaps all of science - than this one. I'm not sure there can be an idea more important, because it strikes at the core of why statistics are used, how they can be misused, and what it means to think critically.
Of course, with my primary topic of research being poll data, this applies directly, and I'll build on it. But make no mistake: this axiom applies to sports data, medical research, population statistics, finance…anywhere statistics are involved.
In introductory stats classes, students are often provided a problem, an equation, and expected to calculate the correct answer. The exercise trains them to follow procedures, plug in numbers, and arrive at a solution. I suppose at the introductory level this is necessary. But this approach rarely teaches them the more important lesson: understanding what the result actually means, and why the formula exists in the first place.
Here's how I think of the problem - and how I propose it be taught:
What problem do I want to solve?
What data or facts do I need to solve it?
This is perfectly acceptable for an introductory level. It moves beyond selecting a formula and plugging in numbers, and teaches that even if you can't personally solve the problem, you know what information is needed to solve it.
This applies just as well whether the “problem” is finding the area of a rectangle or the efficacy of vaccines.
By understanding the data needed to solve a problem (and perhaps what information seems relevant but isn’t) when a charlatan or purveyor of pseudoscience confidently presents some data, you are not so easily fooled.
In other words, the process emphasizes understanding the meaning of the data over mechanically producing an answer - or even producing an answer at all. Students learn to distinguish between knowing a procedure and understanding a problem.
This is statistical literacy in its purest form.
Richard Feynman, in his lecture on how to test competing theories that both seem to produce valid outputs, lamented that scientists often followed procedures that took the form of:
“Never mind the philosophy…just guess the equations, the problem is only to compute the answers so they agree with experiment.”
Again, finding a formula that works to solve some problem - wonderful, and important. But explaining why it works, and why it might fail - understanding the implicit assumptions - that's a higher level of thinking than “got the right answer who cares bro.”
And identifying in advance such “got the right answer” type thinkers offers the ability for more sophisticated minds to improve on methods by identifying the conditions in which the calculations “got the right answer” and those where they might - or will - eventually fail.
This pattern is evident throughout history. Whether it's something hard to test like the orbit of planets, easy to test like the Monty Hall Problem, or counterintuitive like the mass of an object versus how quickly it falls…
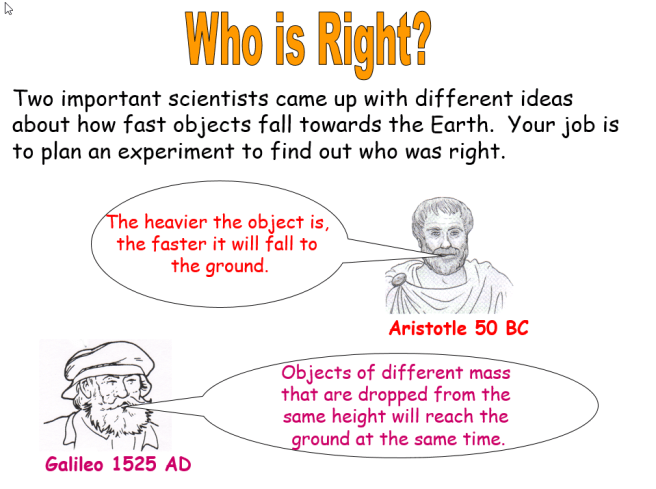
Note how long the world's smartest people believed something that is very incorrect because of how obvious it was.
What seems obvious isn't always obvious, that's why the scientific method exists in the first place; in fact, if you ever have a serious discussion with someone, and you ask them to explain something - and they contend that it's “obvious” - you have likely discovered a gap in their understanding. Stating it's “obvious” is both a deflection and a subtle ad hominem that implies you not fully understanding something reflects on your intelligence, to distract from the fact that they feel like they know it…but can't explain it.
The problem has been explained more in depth recently, and it's called the illusion of knowing.
In short, familiarity produces comfort and fluency, not understanding. Analysts might know all of the terms in the margin of error formula, use it often, and mistake this regular use (or their years of experience in the field) as proof of understanding.
But the reality is, finding the right answer often requires questioning and testing the simplest assumptions - even those that seem obvious - and realizing that reality doesn't particularly care about “years of experience.”
In the case of Ptolemaic Astronomy, they “got the right answer” almost all of the time. As such, it seemed foolish to question the most basic assumptions about whether the Earth was stationary. The world's most brilliant statisticians (including those at MIT) failed to solve a problem a few years ago that many high school students can solve today.
Indeed, one of the most brilliant people in history apparently didn't bother to test the rate with which objects fell because the answer seemed…obvious.
Likewise, Literary Digest’s poll - though unscientific - “accurately predicted” the result of four consecutive elections. As such, it was considered the gold standard…until it wasn't. Getting “the right answer,” not valid processes or even logic is all the field cares about. And not much has changed.
The problem with all of this, I believe, is that otherwise brilliant people believe these are lessons of the past - not the present or future. They believe the solution to the Monty Hall Problem is “obvious” and that if they had been presented the problem in the 1990s - when the credentialed experts were almost universally wrong - they would have obviously been able to solve it and overcome the consensus.
They are born on the shoulders of giants but believe they have climbed there.
Established procedures and accepted assumptions shouldn't be questioned just because you think they might be wrong; they should be questioned because you think they aren't.

Lesson 2: Logic is more important than math
Statistics: what the data says. It is a branch of math
Probability: what the data means. It is a branch of logic
This is not to diminish the importance of statistics. It is to say that without asking what problem needs to be solved, numbers alone cannot guide reasoning. Logic provides the framework for interpreting results, determining what information is relevant, and connecting observations to conclusions. In short, mathematics tells us how to calculate; logic tells us what it means.
Probability itself is a remarkably new field, given the age of relatively more complicated fields like physics and calculus. But probability isn't purely math: probability is the logic of uncertainty.
Uncertainty can be quantified, but as evidenced by the responses to political forecasts that conclude a forecast is “wrong” when someone given “about a 67% chance to win” doesn't eventually win…thinking you understand what something means, and truly understanding it, are quite far apart.
Seemingly simple statistical statements are often very poorly understood.
Indeed, this exact logic holds true at the highest level of political data:
They conclude that a candidate being “ahead” in a poll or poll average - if they don't eventually win - is evidence (or proof) that “polls were wrong/missed/failed.”
When I politely present some simple data - a poll average of 46-43 with 10% undecided, for example - there are a lot of very big assumptions being made if you conclude the person at “46” must eventually win (and win by about 3) or else polls were wrong.
It's simple arithmetic, in fact, to show that undecideds favoring the candidate at “43” can - by itself - cause them to win, even if the poll were perfectly accurate for the population at the time it was taken.
This is a trivial mathematical proof (forgive me for violating my rule on calling things obvious) - but the problem isn't the math. They understand the math.
The problem is the logic.
Because of the 100 years of implicit bias in the field - that undecided behavior can be assumed to follow some rule (splitting evenly or proportionally to decided voters…incompatible and conflicting statistical conventions that literally depend on which country you were born in) the possibility that they could overwhelmingly favor the candidate BEHIND in the data is considered so objectionable that they pretend it can't happen.
Even when presented with irrefutable data that it can and has it's dismissed as a rare exception.
Back to that thing questioning established procedures.
But perhaps most telling about the flaw in reasoning, is that “in the long run” it is implicitly accepted that undecided voters will converge on some split (usually 50-50) - which is the rationale given for pollster grades that assume a 50-50 undecided split. Even if the grades are inaccurate for any given election, “in the long run” the 50-50 assumption will make for accurate grades.
Ahem
Taps microphone
Prove it.
To quote myself:
Of course, the idea that polls are predictions - which is the indisputable (incorrect) consensus within the field - is flawed at its core. But even if I were to grant the grading procedure as worthwhile, it still lacks validity.
Why is a long run 50-50 split for undecided voters accepted as true? Why not 75-25 against the incumbent, and 60-40 against the party of the incumbent when there is no actual incumbent?
Why do we use the same rules for Senate races as House races as midterms as Presidential Elections?
The reasoning, I suspect, is obvious.
The field seems to be so concerned with finding a formula that provides the right answer that they disregard the philosophy behind it.
That's without getting into the discomforting mathematical reality that it would take multiple human lifetimes of data to have a sufficient sample size.
In any case, my work at its fundamental level is simply challenging the field's consensus - the historical assumptions - that undecided behavior can be modeled unconditionally.
Historically, it's as though they're claiming heavy objects fall faster, and I'm climbing a tall building to drop two objects of disparate weight to test it. Instead of anxiously or even passively following what is very easy to test, they demean or understate the value of the findings.
As with “so they fall at the same rate, so what?” - the implications of the understanding that polls aren't predictions are far greater than the headline.
One of them is this:
While polls are not predictions, they are our best tool for informing them. And understanding that polls are not predictions teaches us - as Panagakis also noted - that “rules of analysis are necessary.”
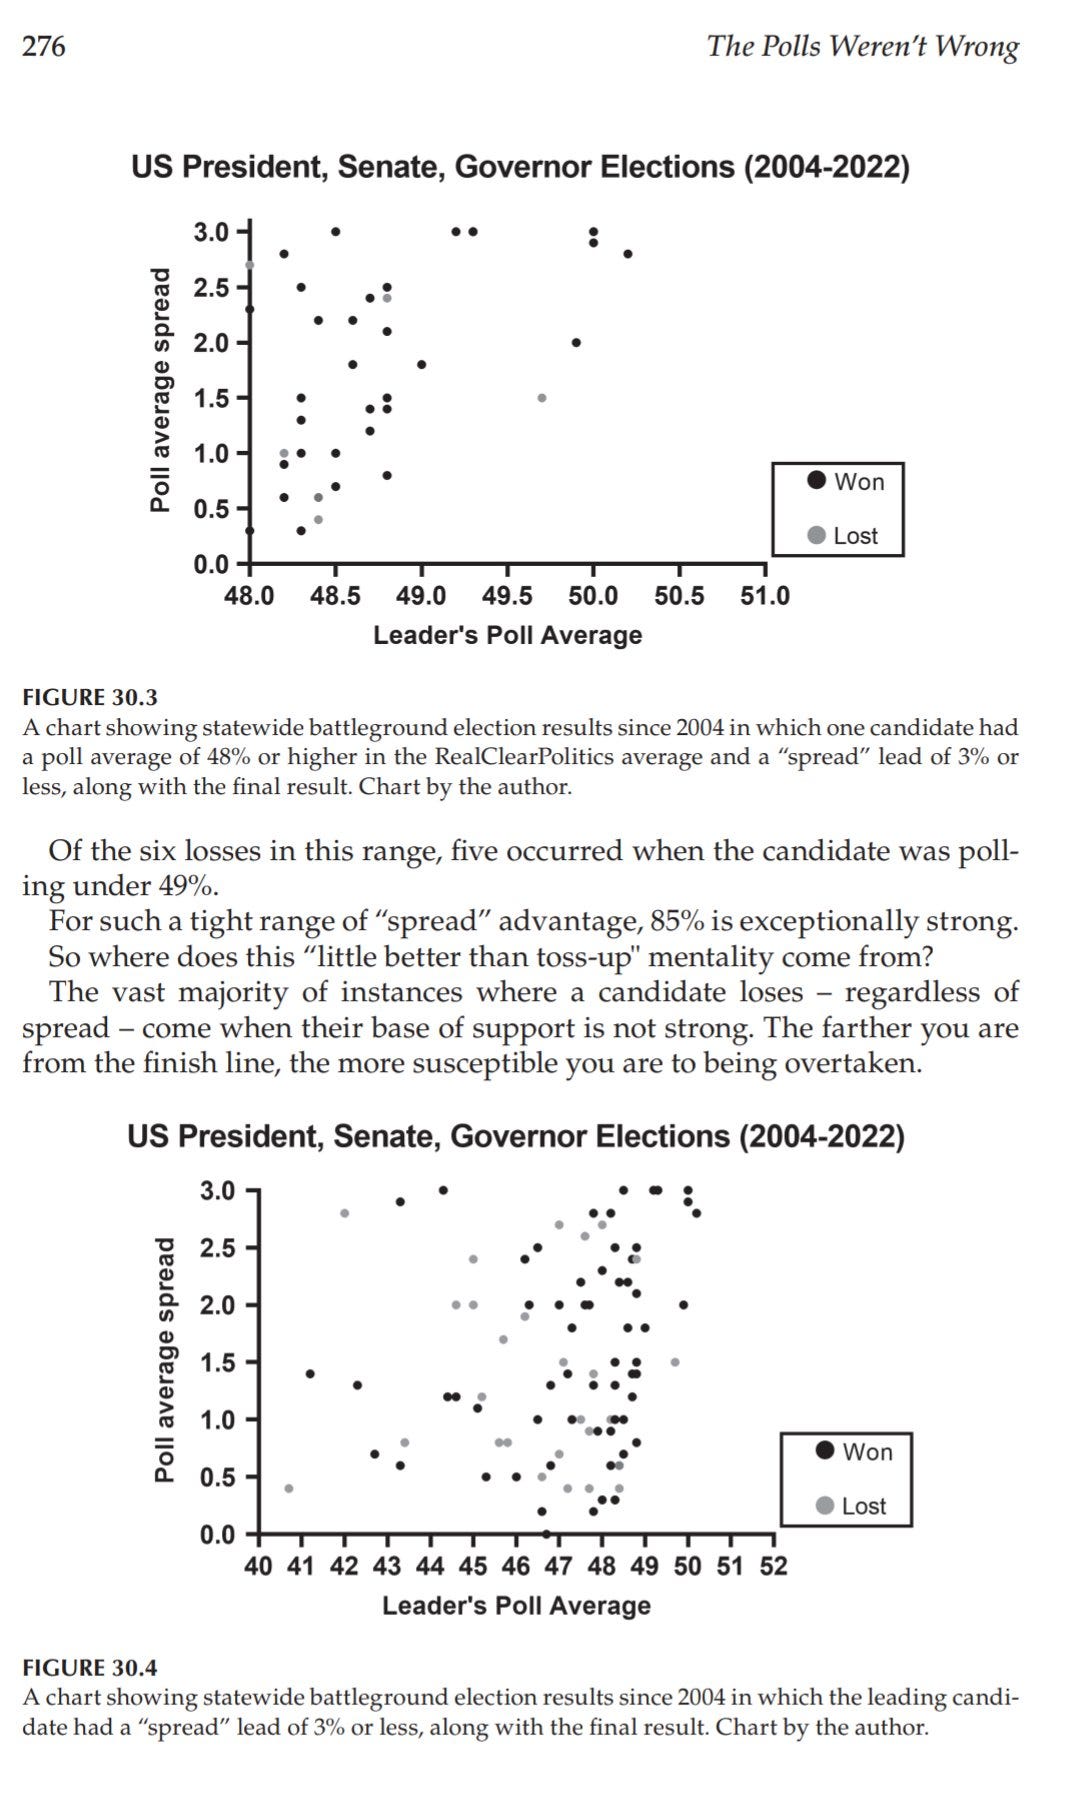
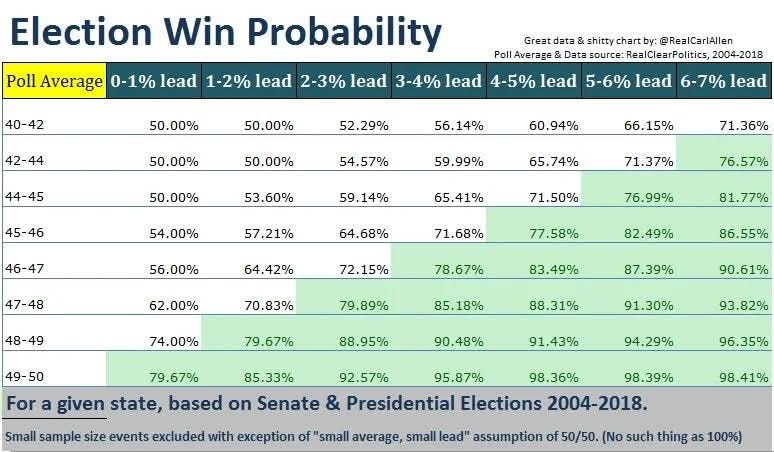
My research shows that a small lead with a poll average close to 50% is far preferable to a larger leads far from it. Indeed, I believe that this is a conclusion that follows directly from an understanding of how polls work: they are an approximate base of support, not a prediction of an outcome. And this understanding is only possible if you allow yourself to escape the trap of polls as predictions that currently forms the field's consensus.
And when Nate Silver published the following in 2012, he concluded that leads of “2 or 3 points” in highly polled states were very strong leads.
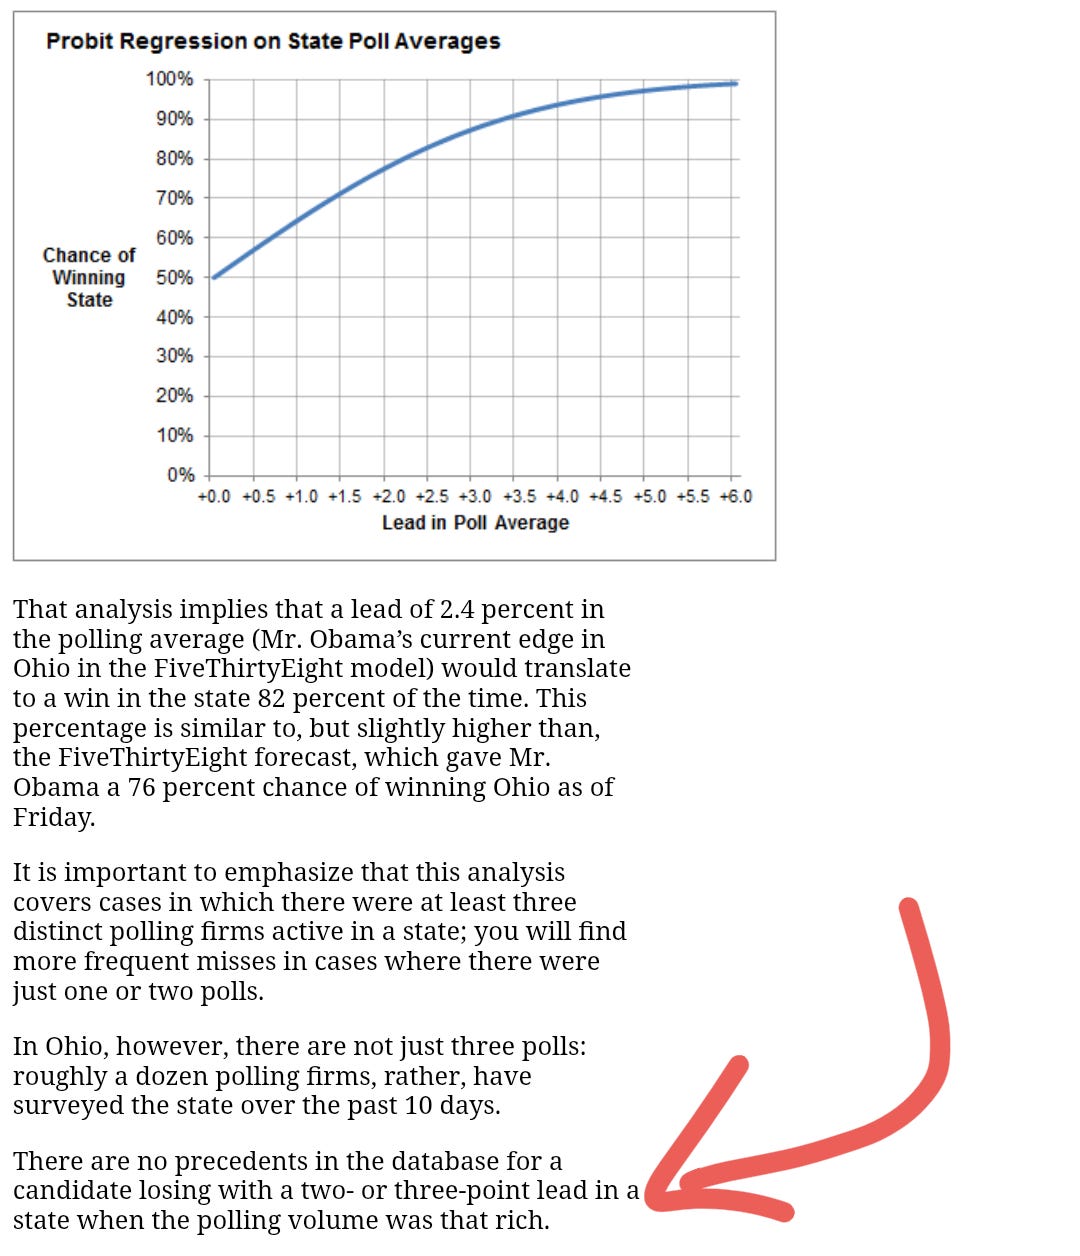
He's observing an output with no valid underlying philosophy.
Of course, Panagakis addressed this decades earlier…and there's nothing wrong with not reading everything every person has ever written on the subject.
But the lack of intellectual curiosity in challenging your most fundamental assumptions - that “obviously” how much a candidate is ahead by in a poll average is a meaningful proxy for their win probability - violates the most basic principles of scientific reasoning. The question is not whether the number can be calculated, but whether it answers the question being asked: how likely is this candidate to win this election?
Treating a margin as a probability substitutes familiarity for logic, and convention for understanding. It confuses what the data say with what they are being assumed to mean.
Lesson 3: A Thought Experiment (and Actual Experiment)
I have a database of 10,000 responses to the following question:
Of the following, which is your favorite color?
Red
Blue
Green
The order of the options were randomized in the survey.
Your assignment is to estimate the percentage of respondents who said which color was their favorite.
Just guess. Make your best guess.
*Answers are turned in and reported*
As a class, here is the average of what everyone guessed. Based on this information, would you like to update your guess?
*Answers are turned in*
I took a random sample of 600 from my database. It yielded:
Blue: 48%
Green: 29%
Red: 23%
Based on this, would you like to update your guesses?
This step, of course, provides far better information than an individual guess, or wisdom of the crowds. While some students will cling to their original guess like Monty Hall contestants, most understand why this data far supercedes its predecessors. “Why” is a good question here.
Depending on the class, you can even discuss the margin of error.
Now, the first super hard, obvious question:
Given that poll data, what does it mean?
Challenging learners to explain what feels obvious is one key difference between teaching and lecturing.
Any answer that takes the form of:
“The 10,000 responses in your database are probably close to those percentages” is fine.
Take a few more polls with the same sample size, to illustrate the variability of these ideal polls.
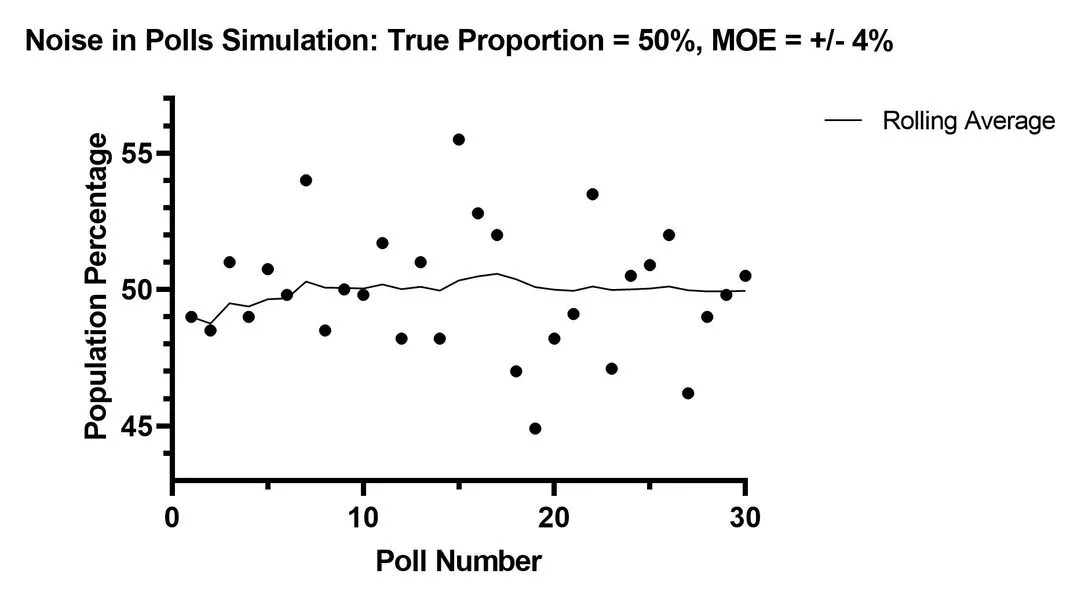
Blue, at 48%, would probably return some results over 50% and some under 45% given a few random samples.
The lesson “fluctuation is normal and expected” is good here.
Having established that the students understand what the data means - not just what it says - drop the Monty Hall, Literary Digest, Nate Silver-sized piece of variable change on them:
A few days after the earlier survey, I asked the same 10,000 people:
Of the following, which is your favorite color?
Red
Blue
Estimate the percentage of respondents who said each color was their favorite. Your grade on this assignment requires providing a correct answer. Extra credit for confidence intervals.
Discuss in the comments!
A lot of great points. I keep seeing similarities with economics commentary - most of the time what sounds 'sophisticated' is just masking wild assumptions about how things work (tariffs/inflation)
It's similar with the difference you mention around statistics and probability.