I'm tapping the sign
I'm tapping the sign
"Ahead" does not equal "favored"

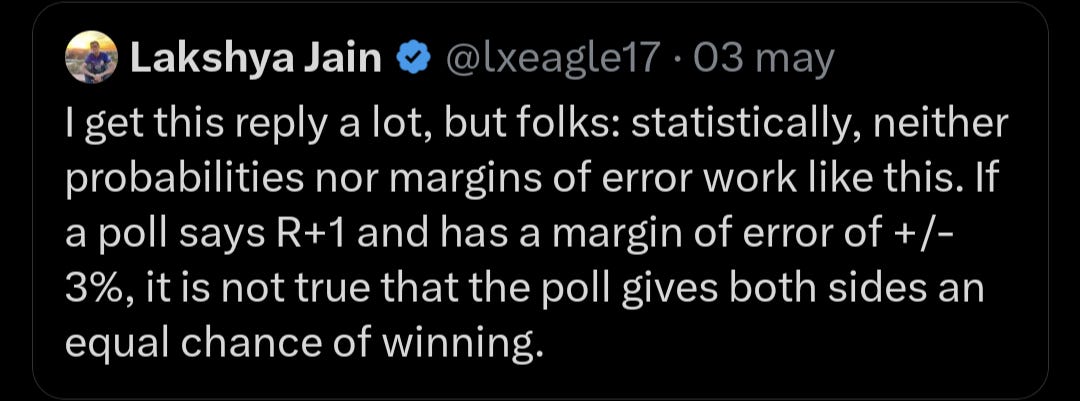
There's an absolute plague within the polling community - experts included - that conflate polls with predictions.
They really believe that the “margin” or “spread” in poll(s) is predictive (or a prediction) of the eventual result.
And I'm sick of it. Absolutely sick of it.
When I point out this obvious disconnect between what is true, and what experts say is true, there are two reactions. I'll address them both as concisely as I can.
Experts know that polls aren't predictions.
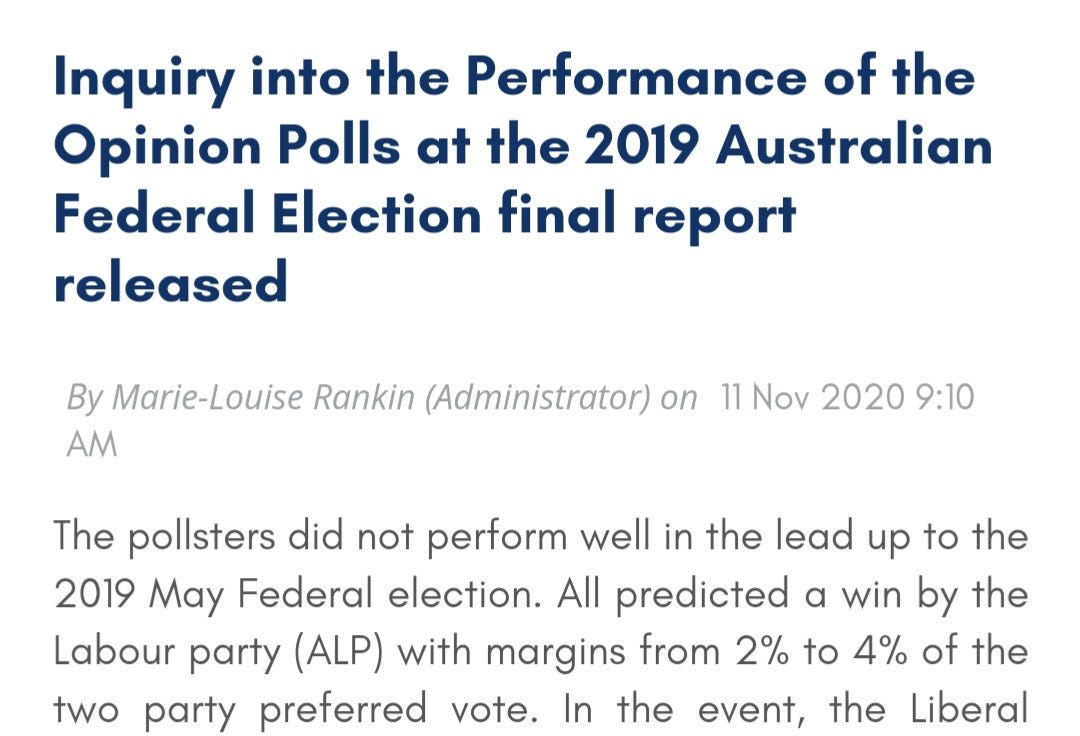
No they don't. Every major organization I've read - the AAPOR in the US, the British Polling Council (BPC) in the UK, Statistical Society of Australia, all comprised of panels of experts, in their reports outright state they believe polls are predictions.
A selection from the AAPOR 2016 Report on the “polling failure.”
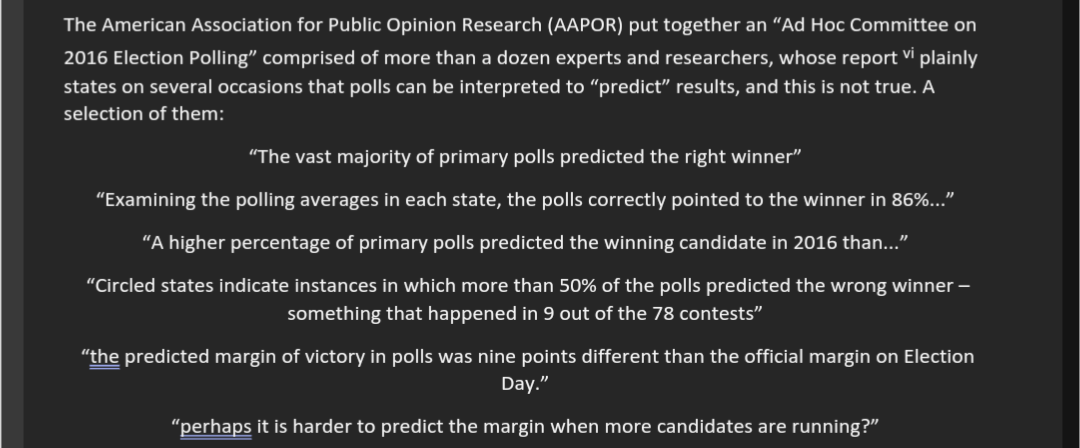
This is a selection. There are dozens more that imply it, so I opted to only include those that outright state it to avoid any attempt at apologetics.
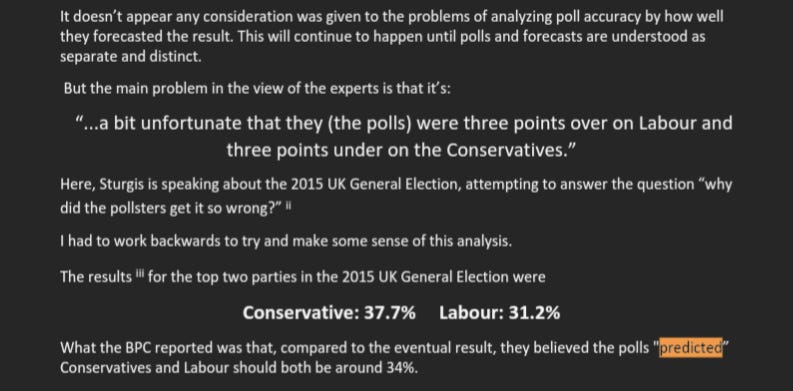
Here, a very small selection from the BPC.
And this one from the Statistical Society of Australia, because I haven't done as much research on their elections but I'm inclined to believe things aren't going well there either.
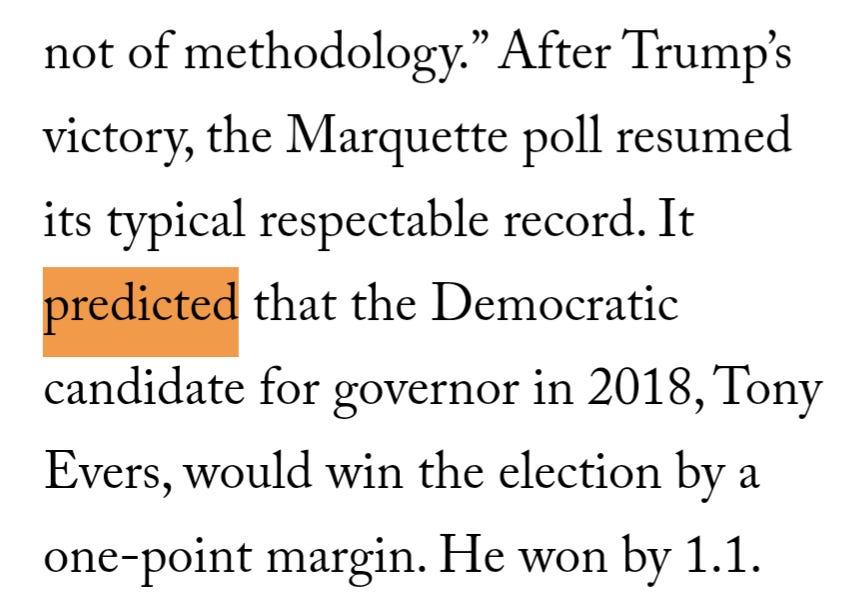
And this one from the new head of whatever his title is at 538, in his book.
They're wrong. Period. All of them. It's not debatable. They can either admit they're wrong and fix it, or continue being wrong.
I know that sounds direct, but it's a concept that is simple enough that it can be explained (if not proven) in a Twitter post.
The math that underlies the statistics governing poll data requires comparison to an unchanging population.
“Generalization” is not an advanced topic within inferential statistics. Yet experts, comparing polls to elections (with no adjustments for known confounders) outright fail.
Polls taken days, weeks, or months from an election are not an unchanging population compared to an election. This is trivial to prove, also.
Then there's the whole “undecided” problem that all analysts ignore - by guessing what undecideds “should” do - and assuming their assumptions can't be wrong.
(US analysts assume undecideds should split 50:50, non-US analysts assume undecideds should split proportional to the already-decided, and any deviation from this means the poll was wrong. Yes, it's that dumb).
What does poll data tell us? It's an estimate of a simultaneous census. If an ideal poll is taken simultaneously from a population, a census that asks them the same question, will produce a result within the margin of error as often as your confidence interval specifies.
That's it. Nothing to do with the eventual result.
If you want to contend that political polls “can't be ideal” or that a “simultaneous census is impossible” in political polling applications, it literally does not matter. Your feelings about what is or isn't possible doesn't govern math.
The math that underlies margin of error and confidence intervals is in relation to a simultaneous census. Not an eventual result.
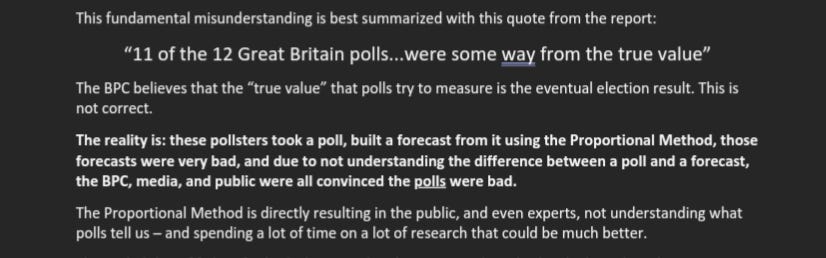
That actual experts would say the election result can be taken as the “ground truth” for poll accuracy is a gigantic red flag that they don't understand what poll data means.
The other common reaction is that it's “not a big deal” that they conflate the two.
This alleged expert made that exact point, using words like “semantics” and “pedantic” to describe my problem with the conflation.
It's semantics to differentiate between mean and median. To differentiate between credible interval and confidence interval. To differentiate between registered voters and likely voters. The list goes on.
So?
That doesn't mean it doesn't matter.
And if you think it doesn't matter, you don't understand the topic well enough to be considered an expert in the field.
As it relates to statistical literacy in the public, it's a much bigger problem than all of those other examples I gave.
There are literally hundreds of examples I can cite in the past 4 years alone, and even my full forecast pointed out where, how, and why, the alleged “best forecasters” were wrong in key states. It all has to do with their conflating of polls and predictions. And that's not even getting into the pitiful and terrible forecasts from 2016, which are made especially reprehensible when those experts refuse to take accountability.
But I'll be concise. I'll pick one.
Every election teaches us lessons, and how well we learn those lessons speaks to the quality of our analysis.
Understanding how and why a candidate “ahead” in the polls might not be favored is not that hard.
It simply requires understanding the difference between polls and forecasts.
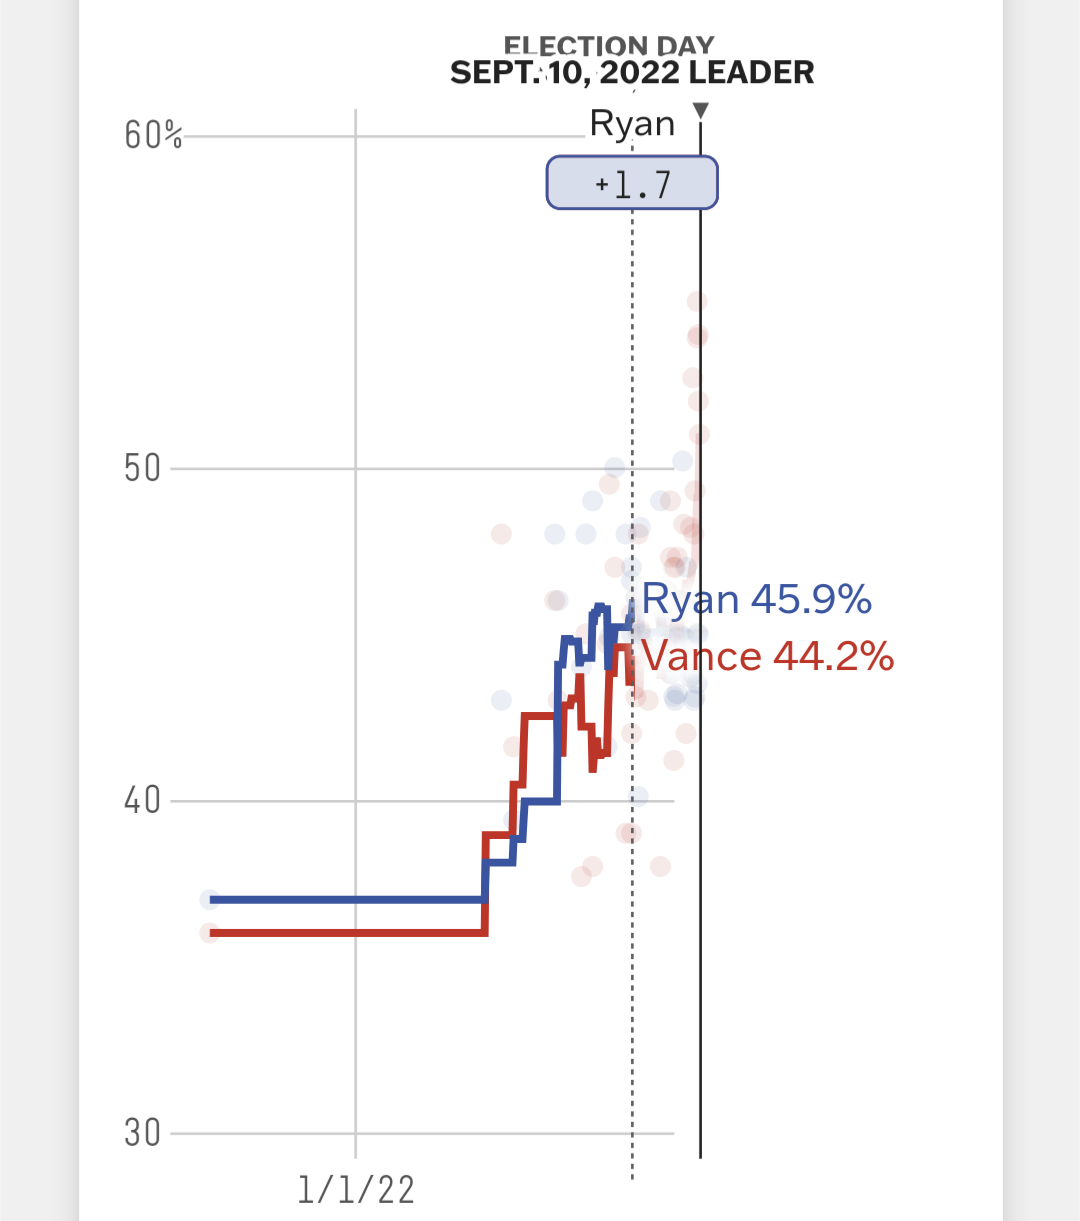
For most of 2022, in my home state of Ohio, polls and the poll average showed Democrat Tim Ryan “ahead” of Republican JD Vance.
Yet, the absolute consensus among experts - which I supported - was that Ryan was still a relatively large underdog in that election.
How could that be? If he's aHeAd?
If you understand political data, you can probably make sense of it. Ohio leans Republican, most of those undecided voters probably leaned Republican. It's not difficult math.
But I want to start with an even easier example.
One of my favorite analogies: sports!
If I'm in a three-point shooting contest against Steph Curry or Caitlin Clark, the possibility that I make my first shot and they miss their first is not that far-fetched.
Does that mean, in the rest of the contest (consisting of 25 shots total) I'm favored? After all, I'm ahead!
About 100% of people would, rightly, conclude “no, just because you're ahead, doesn't mean you're favored.”
They wouldn't even ask how good of a shooter I am! Nor does it really matter, in terms of win probability.
Does it matter how good of a 3-point shooter I am, in terms of how much I'll probably lose by? Oh yeah. Of course it does.
But win probability? Not really.

I've literally won 3-point contests before, against other good shooters. My barely average athleticism is was made viable by the fact that 3 > 2 in basketball. Math is all I had on my side in that sport.
But even my most competitive hubris would not allow me to assert I would be a favorite in a scenario where I made the first basket, and an elite shooter missed.
You could even grant me a 5-point “handicap” at the beginning of the contest, and I still wouldn't.
Most people intuitively understand the current score is only one variable in calculating who should be favored.
The “unknown” variable - far more important - is the percentage of remaining shots I will (likely) make, versus the percentage they will (likely) make.
Simply put, does being “ahead” by itself, mean I should be favored?
Of course not.
Now, let's replace “shots remaining” with “undecided voters” and you now understand poll math better than experts.
By the way, you can apply this scenario equally, and aptly, to a case where I am “statistically tied” with some elite professional with only 5 shots left. Is win probability a tossup?
Ah, now the analogy is coming together.
In political data, undecided preference, despite what FiveThirtyEight or anyone else tells you, cannot be “assumed known” from historical data. It is an unknown variable.
But based on other data, we can make informed predictions who those undecideds may (most likely) prefer.
Likewise, we can try to estimate the percentage of 3-point shots myself or an elite professional would make.
And if that prediction about what will happen in the future is wrong (I make 0 the pro makes 5, or any outcome in between) that does not mean the score, as it was observed, was wrong!
That's why I - and most everyone in the field - rightfully concluded Tim Ryan was not favored, despite being “ahead.”
Now, this analogy is a little imperfect (aren't they all?) because the score of a three-point contest can be known with certainty, and poll data is inherently uncertain, by definition!
But even if we had perfect poll data, we still couldn't conclude “ahead = favored”
This is why when otherwise smart people say “Trump is ahead” and correlate that to win probability, there can be no other explanation except for the fact that they don't understand polls ARE NOT predictions.
Polls do not provide win probability.
This kind of analysis needs to stop, because it is misinformation.
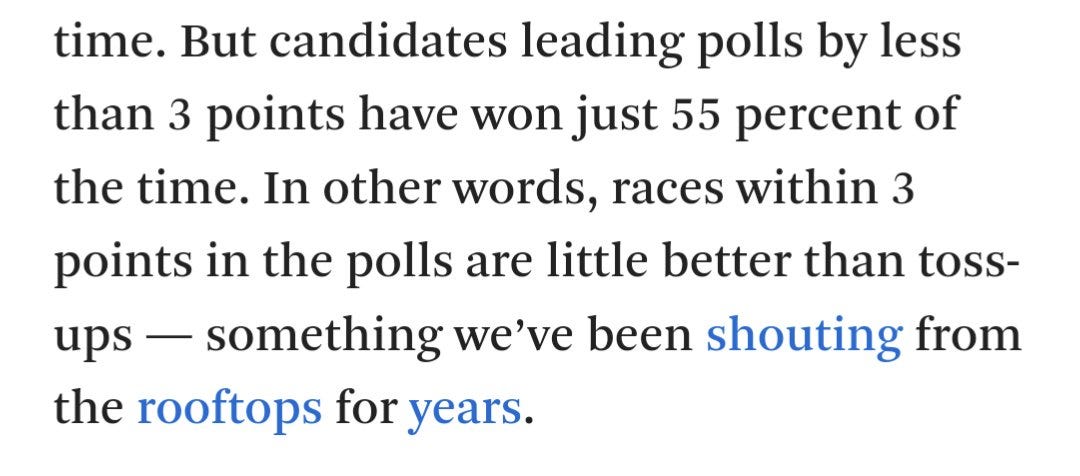
As it pertains to what a “lead of 3 points in the polls” means, a very basic application of the simultaneous census standard (polls measure base of support, not eventual result) would say:
Candidates who poll far from 50% with a small lead are basically toss-ups.
Candidates who poll closer to 50%, with the same size lead, are not even close to toss-ups.
Here, statewide battleground races through from 2004-2022, where the leader's poll average is under 48%, with a small “lead.” Gray dots represent eventual losses, and black dots eventual wins.
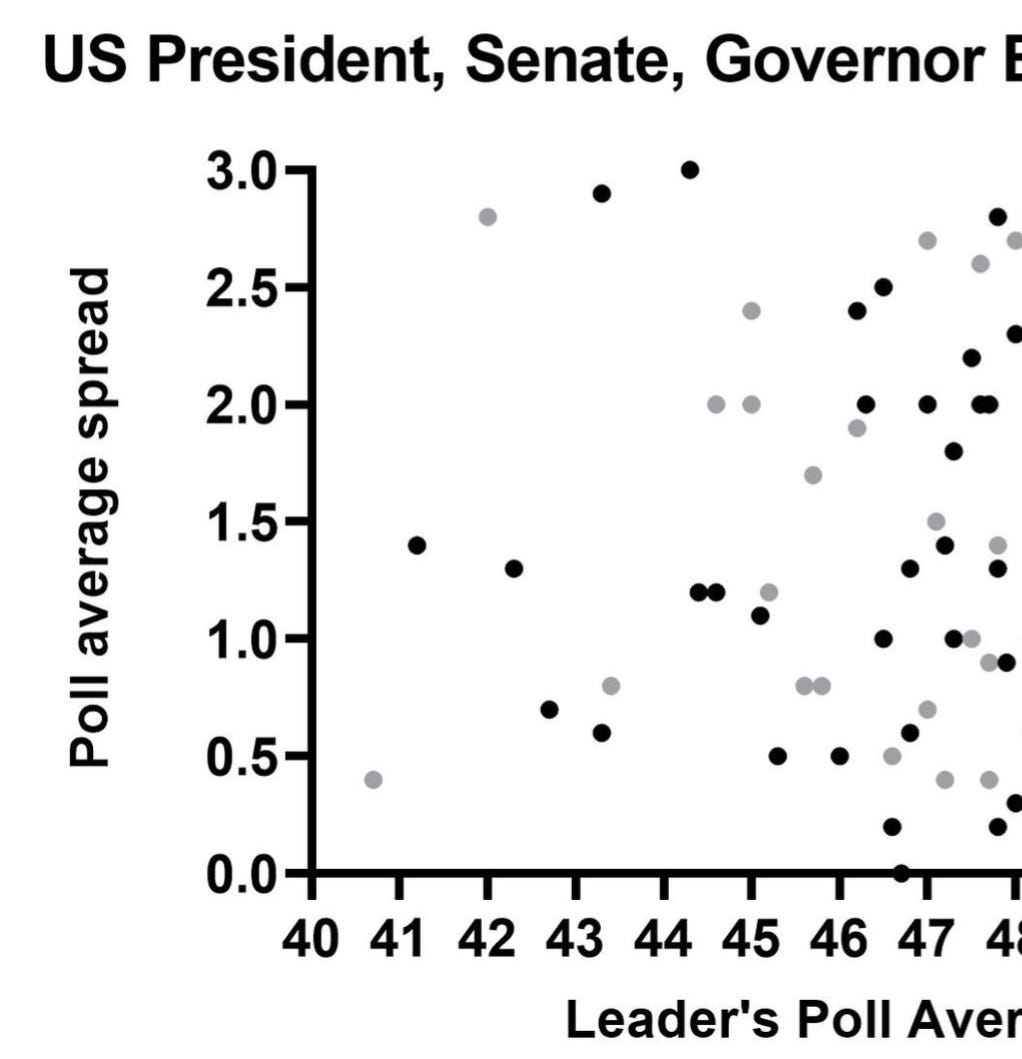
They really are, in these instances, roughly tossups. Just because they have historically been tossups, doesn't mean they will be tossups in every specific case, however.
And how often do you think these same, small “leads” have translated to victory with a stronger poll average?
Should be roughly the same, right?
The answer may shock you.
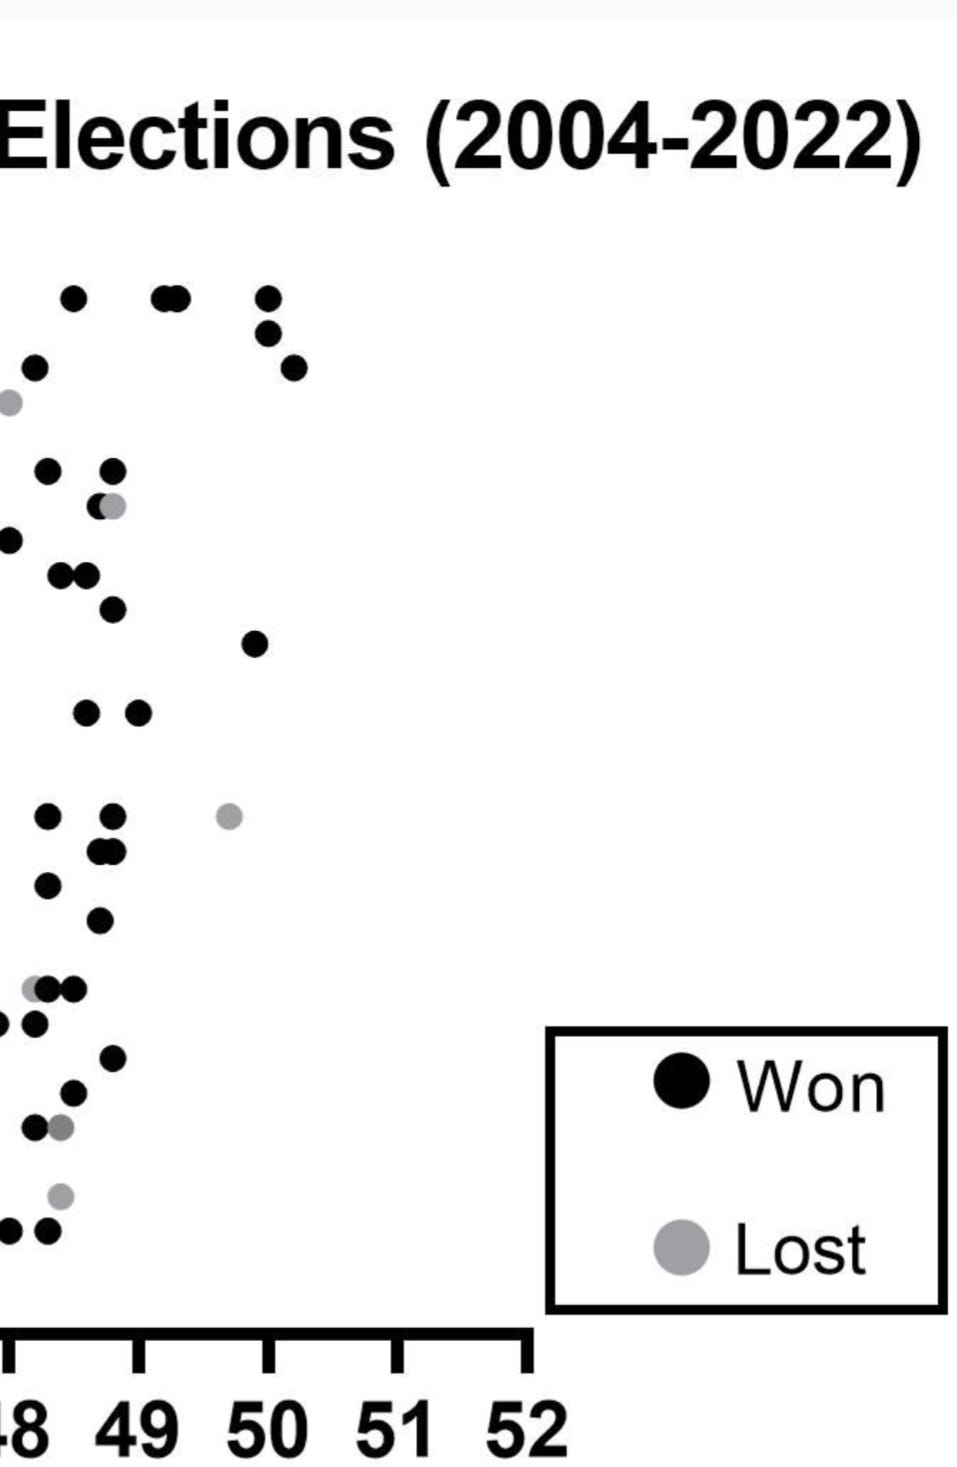
How could that be?
The spread is small!
(This level of reasoning, “Hillary up 4!” is what led to the catastrophically bad analysis in 2016).
In reality, a statistically literate analysis of poll data - one that understands that polls are not predictions and that spread is a junk metric - unironically directly leads to being able to use polls to make better predictions.
It also offers the pleasant accountability side effect of “if my forecast was wrong, that doesn't mean the polls were.”
It's why I was able to beat literally every UK forecaster in the London Mayoral Election last week, many others in the recent past, and why my inferior math will continue to produce superior forecasts.
If you found this article interesting or otherwise informative, good news: I wrote about these topics in much more depth in a book coming in September.
Here's my request:
Anytime someone says “if the election were today…” or “well, he's ahead now…”
Do be a favor and direct them to this article, tap the sign, and @ me